3D Atlanta:
As of now, the 3D Atlanta project is taking a new direction by utilizing City Engine to quickly render the 3D models of 1930s Atlanta. We have also been doing some work in the Unity environment by adding the models we created in Blender last semester. Below you can see the final version of my textured model.
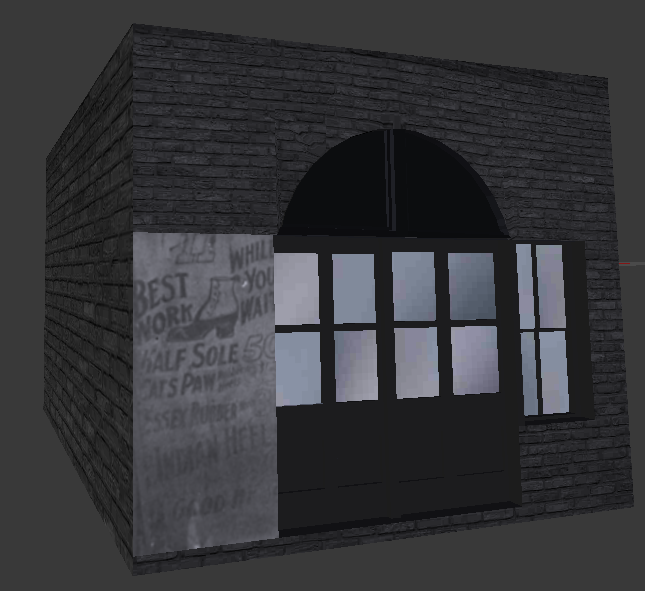
Final Textured Model of 61 Central Ave.
Once the City Engine team has created the base models, me and the rest of the Unity team will continue to post textures on the models and add interaction points to the game.
Virtual Reality Research:
The modeling team has been given an awesome opportunity this semester to be involved in some ongoing virtual reality research going on at GSU. The research focuses on how to adapt the VR environment to the blind community. In order to address this issue, we have been tasked to create a game in Unity that uses sound to help visual impaired players interact with the gaming environment.
The Oculus Rift
The plan is to write three different Unity scripts: an active script where the player shots until a building is hit, at which point the hit will make a sound and the name of the building will be announced. Next a passive script where a building will make a sound and the player will have to find the correct building. And lastly, a simple menu screen where the player will shoot the menu option, that option will be announced and then the player chooses the option. More information will be posted about this project next month.
Weather Analysis Balloon:
This project has made great progress since last semester. I am pleased to say that the weather analysis device is assembled and operational, as well as a desktop interface in which to read the data coming from the reader, which can be seen below.
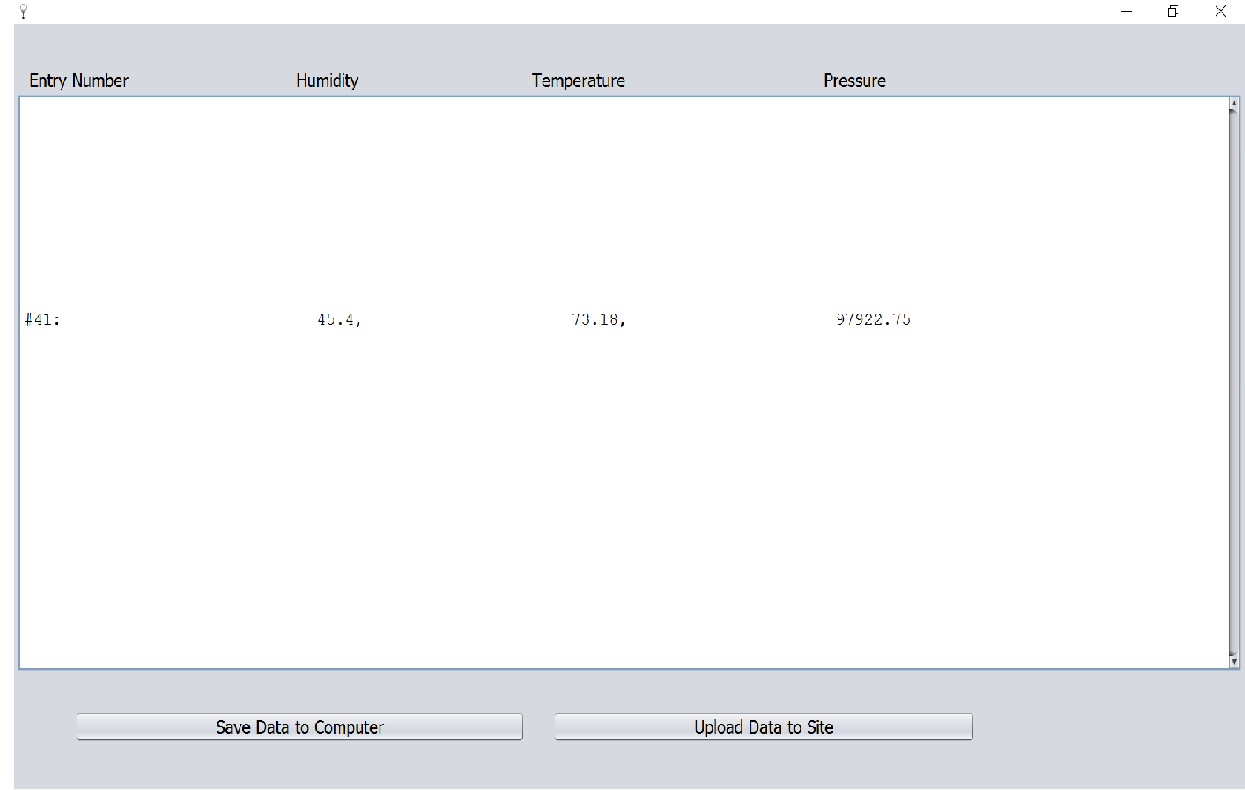
Interface for reading data straight from the weather balloon
The desktop application allows the user to see the data, entry by entry, as it comes in from the device. Every 3 seconds, a reading of humidity, temperature and pressure is sent from the weather balloon to the application. There is also a functionality for saving the data as a text file on the computer and a link to the website so the instructor can upload the data to the internet so students can use the data in their labs. The website is still under construction, and a few more items need to be ordered, but overall the project should be completed soon. Below you can also see the analysis device, the larger device is for gathering the data and sending the data to the computer and the smaller device is for receiving the data.

Weather analysis devices