3D Atlanta Project:
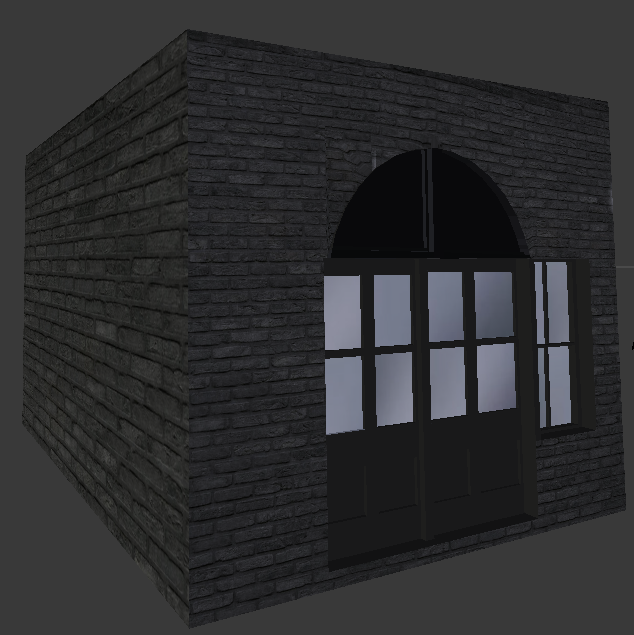
Currently, we are just about done texturing our 3D models. Next step, upload everything into the Unity environment and begin the next phase of the project. These next phases include starting a whole new block and using more coding in the Unity environment to build and texture the 3D models. Below you can see the 3D model of the bottom half of 61 Central Avenue with texturing!
GSU Growth Map:
Not much to say here except that the project has been completed with great success! Here is link to the final project. GSU Growth Map
Climate Lab Weather Analysis Balloon:
All the materials for this project have been ordered and received, giving me all I need to start building the weather analysis Arduino board and begin programming the user interface. Many discussions have taken place between Andrew and I about the next steps in this project, mostly covering the implementation of the MATLAB software into the Geology labs and the physical structure and requirements of the balloon and weather box. We have currently decided to upload the user interface onto GSU servers so the data can be viewed and studied anytime by students and we decided to use a 3D printer to make the specialized weather box for the weather shield and Arduino board. I will be adding a picture of the completed board apparatus by my next post.
Newest project idea! CO2 Reader for the Geology labs:
So this past week has presented me with a new project, developing either a mobile application for Geology students to input data read from the Geology departments current CO2 reading devices or to build new CO2 reading devices using, once again, an Arduino and a CO2 sensor board. This second option still needs a lot more research to determine if it is a possibility. This is because we need a CO2 Arduino sensor that is powerful enough to read even low CO2 emissions. If I am able to build the CO2 Arduino sensor, here is a picture of what the CO2 sensor board would look like.

The mobile application would allow students to upload and analyze their CO2 emissions data as they are reading it in downtown Atlanta. I plan on designing a map with the recovered data to show the points in downtown with the highest CO2 readings.