by Jack | Sep 21, 2016 | 3D Atlanta, 3D modeling, Atlanta connections, data visualization, News, SIF Projects
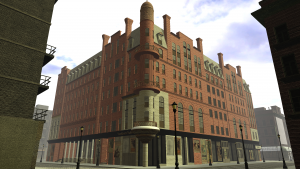
It has been over half a year since the last update on the 3D Atlanta project. Nonetheless, the project has constant been evolving and maturing. The 3D Atlanta group and I have been high at work to contribute our best to the project. At the time of the previous update,...

by Valerie Robin | Apr 2, 2016 | data visualization
I have been on the job market since September. The academic job market takes just short of forever, and is a HUGE commitment. As a result, I have become curious about other job markets and how they work. I essentially know exactly nothing about how to get a job...
by aboll1@gsu.edu | Apr 20, 2015 | data visualization, digital pedagogy, innovation, mapping, SIF Projects
As finals week quickly approaches, we are working at full capacity to bring projects to a space of completion. And while the thought of the end of the semester brings along with the quintessential dialogue of, “…gosh…where did the time go?”...
by Ramsundar Sundarkumar | Mar 1, 2015 | data visualization, mapping, SIF Projects
Project: Online Deliberation Mapping Tool Development As planned, version 1.0 of deliberation map was completed. It includes following features: 1. There can be only one seed for the deliberation map. When the map starts, it will look like this. 2. Any body can post...
by Ramsundar Sundarkumar | Feb 3, 2015 | data visualization, mapping
Project: Online Deliberation Mapping Tool Development Before we start implementing the project, we need to decide the timelines and milestones so that the product can evolve in a systematic fashion. To do this, we needed to prioritize the features and decide which...
by Dylan Ruediger | Jan 26, 2015 | data visualization, digital humanities, How To
As the Hoccleve project nears our first major milestone, the digital publication of an edition of Hoccleve’s holograph poems, we are beginning to ask questions about how to transform our XML into an HTML display. Thus, we are embarking on a graph design/display phase...


