The View from Above- Atlanta Aerial Photo Project

I like maps. If you have read any of my other blog posts you may have caught onto. Maps are great tools that help viewers visually gain a spatial understanding of whatever it is the map is trying to convey. As a Geoscience major at Georgia State University completing my GIS certificate, I approach every problem or interesting topic I face, with a spatial mind set. It is amazing all the ways we can present data that seems to have no spatial implications solely, but when coupled with other elements can create a provoking and informative map.


Photographs are an instance of data that can be powerful when visualized spatially. An image captures one moment or instance and it is essentially frozen in time, the image serves as a static representation of the subject matter. When combining multiple representative images with spatial information, the images can then come to life and display the dynamic change of said subject matter. The Aerial Photograph project does just that with the metro Atlanta area and surrounding counties being the subject matter.


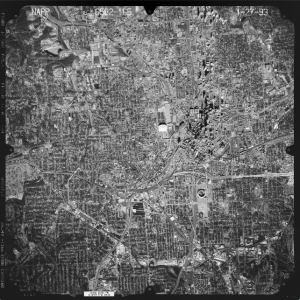
Aerial photographs are photographs taken of an area from above. The Aerial photographs project takes old archived digitized aerial snapshots from several decades starting from the 1940s of the Metro Atlanta area, of which we stitch and then georeference together to create complete and geographically accurate aerial images of each year. 

Atl Aerial Image 1

Atl Aerial Image 2

Atl Aerial image3

Atl Aerial Image Stitched


The images come out to be extremely large in file size, but equally as detailed. These images will serve as complete snapshots of how the metro Atlanta area changed from 1940s to now. They display how land use and land development progressed through the past 60 years. With the aerial images researchers can use them to study urbanization of an area, and when layered with other data can be used to formulate a compelling story.


Until Next Time,


Alexandra Orrego
Mapping Atlanta’s Greening Efforts

2017 has been a jarring year for coastal states, with intense hurricane after hurricane slamming into our neighboring southeastern states, creating an influx of storm escapees from Florida and the Carolinas. Atlanta’s landlocked geographic location is already growing in population, and with predictions of rising sea levels and an increase in the occurrence of intense storm systems, this phenomenon of Southern relatives making impromptu visits may become a common occurrence. The intergovernmental panel on climate change states that “scientific evidence for warming of the climate system is unequivocal”, so is it surprising that based on a study by the Yale program on climate change about 70 percent of Georgia residents believe global warming is happening, and only 55 percent say they are worried about it.
Although Atlanta may not be affected by rising sea levels, climate change will affect our beloved southern metropolis. Temperatures are projected to increase nationwide with southeastern states receiving decreased amounts of rainfall; getting drier and threatening future water supply. Scientists predict an increase in bursts of intense rainfall showers in the city, fueling rapid urban flooding, while cities will also experience extreme heat due to urban heat island effects. While these forecasts seem grim, in the past several years Atlanta has made efforts in addressing our increasingly important issue of climate change.  The City of Atlanta plans a climate action strategy, which includes long-term solutions for increasing energy and water efficiency according to Atlanta’s office of sustainability. The City of Atlanta office of sustainability, launched in 2008, is responsible for implementing environmentally conscious policy, programs, and projects.
As programs and improvements have been made or proposed, I wondered how can someone wanting to track or visualize Atlanta’s progress of sustainability practices gain access to such data. Naturally as an environmental science major at Georgia State University working towards earning a Geographic Information Systems certificate and map enthusiast, I wanted to explore ways to provide this data spatially (on a map). ATLMaps.org has been an ongoing collaborative project between Georgia-based research institutions providing public spatial data for means of creating research projects and linking maps in new and interesting ways. As a Student Innovation Fellow working on building content for the site, I began to do research on already available data on Atlanta’s shift towards being a more sustainable and greener urban landscape. I came across a public database that includes the implementation of an increasingly popular solution to many problems that urban areas are facing: Green Roofs.
According to the U.S. Department of the interior – National Park Service a green roof “is a layer of vegetation planted over a waterproofing system that is installed on top of a flat or slightly-sloped roof”, in other words it means exactly what is sounds like: growing plants on the roofs of buildings. Now, you may be thinking how will that improve Atlanta’s sustainability efforts and reduce our emissions? The answer is A LOT.
Green roofs help with storm water management, because Atlanta decide to become the parking deck capital of the world (not really… well maybe), the city has little greenspace and is mostly impervious surfaces (surfaces that do not allow water to penetrate). This affects how precipitation runs off the roof of buildings, which may contain contaminates and overflow the city’s sewage system, discharging sewage into flowing bodies of water. The plants on green roofs retain water, slowing and reducing the amount of storm water, and can help prevent flooding and erosion. ADDITIONALLY, the growing plant material acts as a filter and can neutralize acid rain, trap dust, and airborne particles. Temperatures in cities are typically higher than surrounding areas due the urban heat island effect, which is again the cause of large amounts of paved surfaces that absorbs the sun rays and radiates that heat, increasing local temps. This may become even more intense as temperatures are projected to only increase. Green roofs reduce this effect because the vegetation a top of buildings absorbs less heat, but also use the heat for the process of evapotranspiration which lowers temperatures on roofs by using heat to evaporate water from the air. benefits of the cooling effects of green roofs only continue to increase, as the insulate buildings better, keeping them cooler decreasing the amount of heat passing into the building This boosts the efficiency of rooftop HVAC and air conditioning equipment essentially reducing energy and energy costs. If all these benefits don’t have you wanting to install a green roof on every building, they also help reduce overall greenhouse emissions by the reduction of fossil fuel combustion used by cooling systems and adding plants and trees increases photosynthesis, lower carbon dioxide from cars and machines, and simultaneously increasing oxygen production. This improves overall air quality. Green roof not only extend your healthy life, the extend roof life as well by reducing extreme temperatures. Green Roofs are a beautiful addition to urban areas they allow an area for residents to enjoy nature in cities, and some even incorporate urban agriculture!
The city of Atlanta built the first municipal green roof in the Southeast in 2003 (That’s right even though they have so many environmental benefits Atlanta was the first to plant one for the public!). The pilot program green roof of City Hall was built to raise awareness for the implementation for green roof across Atlanta’s urban landscape.


This database provides all installed green roofs in the U.S., and will be added as a map layer to ATLmaps.org database. This layer is one part of the increasing interest and research into other data that will include other elements of Atlanta’s efforts to become sustainable. Other directions include including all solar panel installations, air quality indexes, electric car charging stations, etc. These layers can help researchers visualize the progress of connecting programs around Atlanta and this data can even be linked to other issues such as census data and their correlation and may aid in raising awareness for sustainable and environmental practices.

Changes and Updates

The SIF program this month has been one of transition. I continue to work on the research team for 3D Atlanta but have now been added to the team for the Hoccleve project!

3d Atlanta

The 3d Atlanta project has been coming along great with now multiple historically accurate buildings being added to the virtual reality program. Although progress has been made, a more efficient manner to model downtown Atlanta in the 1930s has been needed. 3d modeling can be time consuming as we want the virtual buildings to resemble their real-life facades as accurately as possible. One great solution is to have a 3d modeling class at Georgia State work on modeling the buildings as assignments for their class. The students gain hands on experience modeling real buildings while in turn creating something that will be of significant use to this project and Georgia State.

Unfortunately it is much easier said than done. In order for a beginner to intermediate 3d modeler to create a good model we must provide a storefront or building that is relatively geometrically simple (cube-like), a clear image of the old 1930s facade or building, as well as provide certainty that this building was around in the 1930s, and it fits within the downtown Atlanta area we are hoping to create.

As I continue to search for buildings and images here are some examples of what I come across:


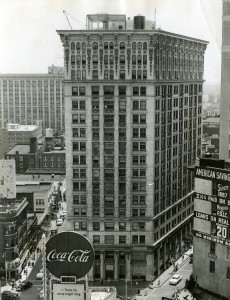
Empire Building- GSU J. Mack Robinson College of Business

Although seeming to fit all the requirements this facade is not too easy to mimic.

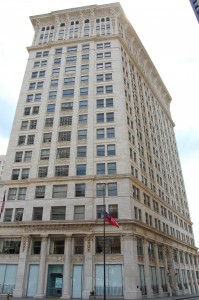
A closer look shows…

Empire building today

The facade of the building is much more intricate and would make this a suitable project for intermediate or advanced 3d modelers to tackle.

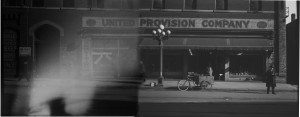
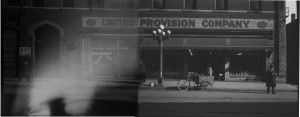
Other issues arrive with buildings that no longer exist but we know once existed. This leaves us to rely heavily on old photos that may be of poor quality such as:


United provisions near underground atlanta

United provisions near underground atlanta

These are a few of the challenges I have been facing lately with 3d Atlanta. I hope to continue investigating suitable buildings for all modeling levels.

Hoccleve Archives

I have been added to the exciting Hoccleve archives project. As a computer science minor I have been itching to gain some hands on coding skills and help the team build out a great platform to study the works of middle english poet, Thomas Hoccleve.

Our goals include creating an interactive database containing all of his works, where one can search for specific lines or words. This would make his poems completely accessible for specific uses.

I hope to learn much more from this project, so stay tuned!


until next time,


Alexandra Orrego

The Age of Preservation and Revival of Atlanta’s Downtown

The growth that Atlanta’s downtown area has experienced in the 2 short years that I have lived here is immense. It makes you truly wonder how such an established city can drastically change over time, especially when Atlanta, being one of the older large cities of the south, does not exude its over a century old age. As I continue to be a part of the research team of the 3D Atlanta project I am able to dig up the old history and structures that were once a part of the city’s skyline. With the virtual interactive platform increasingly improving and detailed buildings being added the research team has been tasked with discovering more historic buildings (built before 1930s) that once, or still, inhabited Georgia State’s urban downtown campus. We have a couple new additions to look forward to in the coming months and I would like to shed some history on them and their importance!

The Candler Building

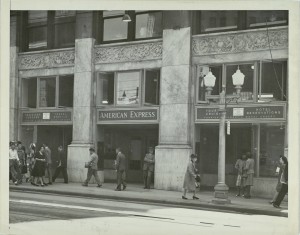
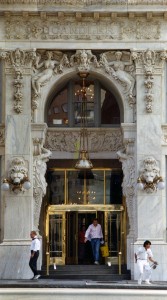
Located in the heart of downtown, The Candler building is one of Atlanta’s oldest landmarks. Built in 1906 by Coca-Cola Magnate Asa Candler and Architect George Murphy, the building sits right in front Georgia State’s new state of the art Law Building and adjacent to the enormous Georgia power building. The building’s architecture display significant attention to detail from its carved facade to its grandiose lobby which still remains almost exactly the same. The building displays busts and statues carved by international artists of the time and is truly breathtaking. Currently the building is used as office space but this year has recently planned to be converted into a luxury boutique hotel called Candler Hotel Atlanta.


american_express_company_office1950s  candler_building_and_surrounding_streets_1955 1955 atlanta_candler_building_2012_09_15_04_6124 the building todayfacade_of_candler_building_19891989 facade


The Olympia Building

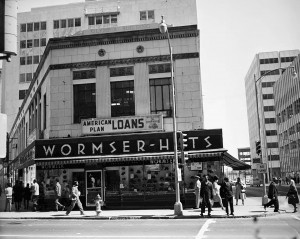
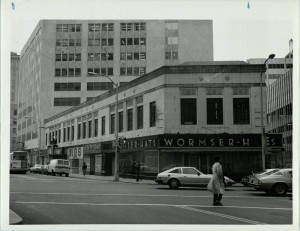
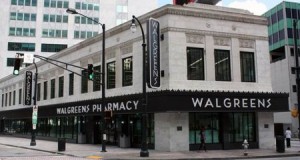
In the center of Atlanta’s Downtown Five Points area the olympia building may be considered small to most. The two story building was built in 1936 and served as a shopping hub. After being threatened of destruction multiple times the iconic building donning the Large Coca-Cola sign was rehabilitated and recently opened as a retro style Walgreens. Real estate investors and Walgreens partnered up to go through a costly revamp of the property essentially keeping its historical value, its facade. In respect to the building’s history  as once a Hat store Walgreens purposefully mimicked the letter that once said Wormser- Hats. The new Walgreens is a convenient addition in the center of Georgia State’s campus and for Walgreens may bring in a lot of great attention.

1967 Olympia building

1967 Olympia building

Olympia Building, !980s

Olympia Building, 1980s

Walgreens Ribbon Cutting , 2016

Walgreens Ribbon Cutting , 2016


It is inspiring to see that Atlantians are moving away from a period of destruction to a period of preservation and revival our city’s roots and structures. With these historic buildings adding value and significance to our downtown skyline, we are excited to see their virtual version in the 1930s simulation of 3d Atlanta we have been working hard to create. As progress continues with creating a futuristic blast to the past, I am continuously excited to see not only the history but also the growth of Georgia State’s downtown campus.

Until next time,

Alexandra Orrego


A Panorama of Atlanta’s Past

There is no doubt that Atlanta has gone through several stages of destroying and rebuilding in the last century, and the growing amount of parking garages and lots can attest to that. Although Atlanta has been considered a commuter city where its a bustling city during the day and a ghost town at night, that has been rapidly changing and another stage of rebuilding seems to be arising.

The growth of Georgia State University and young adults falling in love with Atlanta has strongly contributed to this growth, as well as investors believing its an opportunity support an promising city. With this revival there has been a stronger feeling that Atlanta’s history is one of its most valuable assets. As the hub of the south, Atlanta as a city and community has triumphed through some of history’s most important movements. With this in mind, the emphasis on the importance of the glass plate negatives project is not necessary.

As I continue to work on the Atlanta Glass plate negative photo-stitching project I find myself continuously in awe at the rich history in architecture, culture, and history that I have been able to see during this project. Where I left last our group was getting ready to tackle the hard task of photostitching hundreds of old archived images of a few street that the vidauct (Underground Atlanta) has covered. As the prjoect continues we have found that the address to which the meta data of the images pointed are not entirely correct and its up to us to examine each image in order to create large panoramas of entire streets.


LongPanorama

This is a large panorama of a street where I was able to stitch 4 images together. Its incredible on the amount of detail that is present. As we continue to move down streets we hope to create a world where you can revisit Atlanta in some of its most historically rich moments.

United_Provisions_Panorama

Until Next time,


Alexandra Orrego

Revisiting Atlanta in the late 1920’s

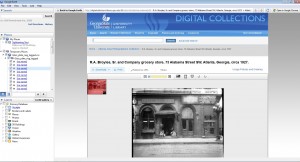
Being immersed in Atlanta’s downtown history is one of the biggest perks that Georgia State University’s location offers students and faculty. One of the newest projects I have been working on takes advantage of this unique opportunity. The project uses Georgia State University’s digital library collection of a series of glass plate negative images that were taken of the storefronts before the viaduct was built over them. Some of these storefronts can still be seen in Underground Atlanta.

The area documented was mostly of Alabama St SW,Pryor St SE, Peachtree St SW, and MLK Dr NW. Although many of the images contained an address there were challenges because address were not relevant to the addresses today and although the image might have been labeled with an address, in the pictures the storefronts had a separate number address. In order to properly Identify the correct geographic locations of where these images were taken, we would need a map of the area from the time period. With the help of the sanborn maps this would be possible.

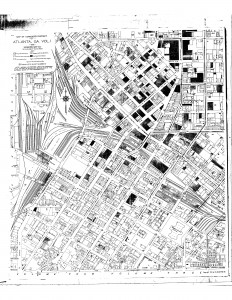
In order to geotag these images in google earth, the old Sanborn maps were to be georefrenced where they would be accurately overlayed  over the atlanta area where these businesses were located. Fortunately the Sanborn map contained the business number addresses that were used in the period and allowed for easier correlation between images and geographic location. Sanborn Map Shown below:


Atlanta+1931-1932+Vol.+1,+1931,+Sheet+0b

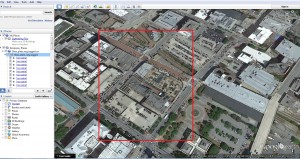
After I georeferenced the Sanborn Maps, other team members were able to attempt to geotag the images, and although not all images were geotag due to lack of information, the idea to fill in gaps based on overlapping storefronts arose. Attention to details on these old photographs is going to be the most important factor when stitching these images together. Using google Earth a majority of the images were geotagged accordingly:

geotagged

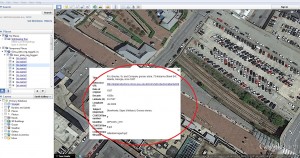
Each Point contained the appropriate information to be able to lead to the image and therefore would make stitching these images much easier.

geotagInfo

DigLibGeoTag

Sitching such images together to create one long panorama of what the entire street looked like has been a challenge. After experimenting with photo stiching software, we came to find that Adobe photoshop would be the best route to manipulate the images the way need to stitch them.

The project has hit bumps but overall the progress has been greater than expected. As we continue to photo stitch our images, the hope is to create a complete panorama of what Atlanta used to look like before the viaduct was built.

I plan to upload the completed product.

Until next time,


Alexandra Orrego


How mapping tools can strengthen Research

During my time as a SIF, I have had the privilege to work with a wide array of technologies and softwares. Through the development of my technical skills and the experience gained I have grown tremendously not only as a student but as a researcher. With this expansion in knowledge of certain technologies I have grown an affinity towards mapping technologies. Time and time again as a SIF and after several projects they have never failed to exude their critical role in research. Whether it be to organize data, promote the visualization of our changing surroundings,or  share data and issues in an impactful manner, mapping has shown to be very useful. I’d like to highlight on the different ways it has made our projects stand out and neatly display research.

I have primarily used google maps, Esri’s ArcGIS, and story maps. Here are several ways to present or organize research through geospatial tools and mapping:

1934 Tax Maps (Georeferencing):

taxmapimage


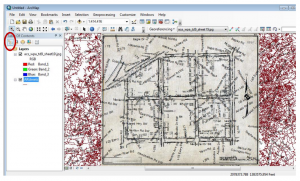
During the 1934 tax maps project, I was to georeference several old tax maps of Atlanta that had been recently scanned and added to Georgia State University’s special collections. This is useful so that once the GeoTiff has been created for an image it can then be opened in a mapping software that will place the map spatially accurate on top of maps of today. This is very useful when seeing how our infrastructure has evolved since the 30’s. These maps also display census data depicting where certain races were typically located, this is useful in the research of anthropology and human geography, simply to name a few.

Tracing a History of Atlanta’s Public Transit (interactive Visualization tool):

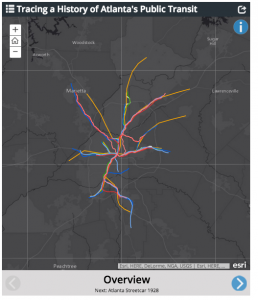
Mapping can also be used to educate and hopefully make an impact. Another project that included heavily on mapping, was the Atlanta Mass Transit project (link to full interactive version below). This interactive map shows the history of Atlanta’s public transit system through almost a decade. Its interesting to read its history of the destruction the revival of mass public transit in our city.

http://www.arcgis.com/apps/MapSeries/?appid=7f0b953943a7490f80e2dc1ebf7f64e3

Screen Shot 2015-11-19 at 5.52.07 PM

3D Atlanta Research (Data Organization & Visualization):

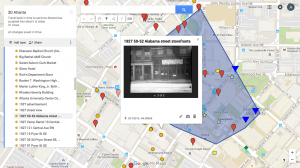
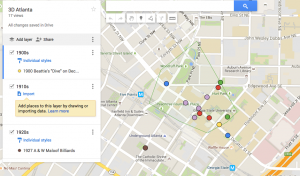
Mapping has shown to be very useful in not only presenting data but organizing it as well. Through the 3d Atlanta project, the research team has the job of finding information and pictures of areas around our campus from the 1920s and beyond. The research team is in place to aid the technical 3d side in order to recreate the most accurate 3d model of downtown Atlanta in the 30’s. With so much treasure out there we had come to the issue of how to organize all of our data. We came up with the idea of placing the images of the streets and information onto a google map so that once the 3d modeling team moved toward that direction in the virtual engine they could simply pull the images from the map where all research was organized spatially.

Screen Shot 2015-11-19 at 6.02.05 PM

Screen Shot 2015-11-19 at 6.02.31 PM

GSU Growth Map (Interactive Visualization transition):

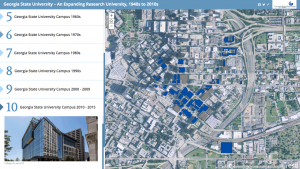
One of the most recent projects where mapping has proved its valor, was the GSU Growth map project we were assigned to aid in for President of the University, Mark Becker, and the Launch of GSU’s Burning Bright Campaign. This project was very rewarding. We were able to use Esri’s ArcMaps and Story Maps to create a great interactive representation of how Georgia State University’s campus has grown and evolved since its founding. This tool has helped to promote the future growth of our university.

Screen Shot 2015-11-19 at 6.06.29 PM


All of these projects have evidently shown the impact mapping can have on research. I hope to learn more on how to incorporate mapping into research and look forward to whats to come.


Until next time,


Alexandra Orrego


Georgia State Universities growth

Most people have noticed the growth of Georgia State University through out not only the last decade but you can even begin to see tremendous growth through as little as 5 years. Georgia State has become an increasingly recognized University for its untraditional campus, and the complications and advantages in which it entails. In addition to such recognition GSU plans to consolidate with GPC by January 2016. With all of the changes being implemented on campus, it was brought to the SIFs attention that it would be a great idea to share such changes/growth that the university has undergone by visually mapping it!

Through the process of mapping out the campus, the dorms/housing built, new facilities, and changes it was clear to see the sudden revamp of the university in such short time. Through such visualization it was easier to see the impact of change the campus has gone through, and as a student, I can personally sense the not so physical aspects of the university change. Its exciting to know that the university in which I am investing my time and money for an education seems to have such a bright and growing future ahead of it. When investing in this mapping project it only allowed for that much more visual validation on how Georgia State has been impacting downtown Atlanta’s dynamic.

As I continue to participate in research projects that work towards highlighting the exciting and impactful history of Atlanta and how it ties into Georgia State and its students, I gain a great appreciation for my educational experience here.

I’d like to continue to work on my mapping, coding, and research skills in order to see what other interesting and useful innovative tools I can create. Updates to come soon!


Until next time,


Alexandra Orrego


Expanding 3d Atlanta through Geospatial research

As the new school year kicks off so too does the ambition and drive to continue our projects as SIF moving with that same force. A now year long standing process, the 3D Atlanta project has really begun to take form, with now a prototype that wows people. As the details and content is added to the interactive 3d game engine, Unity, and the technical side of the project proceeds at a slower pace due to its tedious and time consuming nature, the research group is moving ahead. As a part of the research team on this project, the purpose and mission has been to scour the internet or any other resources available to find any useful images or interesting facts of the surrounding area during the time (1930s). This has been a large task and as each researcher had previously taken off on their own journey for wholesome historical content, we began to note how chaotic and unruly all these files, images, articles, and data can be hard to manage. Through this struggle, I began to use a very well known tool, Google Maps. Through This I have been able to create layers of each time period and since the interactive environment is based on geographic accuracy to the time period, I began to place the images, if possible in the exact location where the image was taken, or the place of which the article was written about.

Since this method the team has begun to realize how useful it is to see such data in a spatial sense. We can begin to see clusters of data in places which might retain more historical value and is appropriate to the period. The objective is to create an easily accessible pipeline of resources once the modeling crew has completed on street, they can then move onto another street from which the researchers have gathered a substantial amount of data. This makes it easier for the modeling/tech team to hash out streets due to their amount of content.  Below:

Spatial representation


In addition to this useful tool for organizing such data, I have come into a few complications:

  1. Google my maps prohibits the use  of more than 10 Layers
  2. The image might get too busy
  3. there is no simple download or view larger function once you view the small pop-up unless you click on the image link.
  4. google my maps is not a usual place to store such data

With these complications, I have been wondering if there is a better way to spatially organize such historical data? With that question I am stuck to believe that maybe such research tool would be useful to develop or create? or has such a tool already been created that I am not aware of?

Feel free to comment with any advice or input of the subject!

until next time,


Alexandra Orrego

3D Atlanta’s Fashion

Updates and innovation!

The 3D Atlanta project has been the first project I have been assigned to as well as the most challenging. The goal of this project was to create a historically accurate interactive 3D model of the street block of Decatur Street and Ivy Street (Now Peachtree center Ave) as it would have been in from 1920-1930. The significance of this street relates to the historical value of Georgia State University’s campus. This street was known to be at the time the blues hub, where numerous famous blues artists had their beginning. Not only did it cater to the controversial African-American blues artist of the day but it was also a spectacle of all backgrounds, it was known to be Atlanta’s nightlife attraction. Theatre eighty-one housed famous vaudeville acts, moonshiners sold illegal alcohol during prohibition, prostitutes roamed the streets, and the decade’s latest fashions were sold all on this block that was then known as a red-light district. All of this controversy adds to the historical and unique integrity to the Georgia State University campus and to Atlanta.

While researching images and information for our street we came to several road blocks; because  of the taboo nature of the block there were very few photographs of the streets and the activities practiced around it. When attempting to create a 3D model of the street visual aid was crucial and this was a major concern. Luckily through much discussion and research we were able to overcome this eventually continue the project with momentum. Now with a significant amount of interactivity and a nicely populated virtual platform we are finally able to see our vision.

My end of the project was mostly research based and once the city block was finally created in the game engine, Unity, it was then time to incorporate further research into the interactive project. With a great effort from all project members we decided to have a newspaper type pop-up display when the user clicked on the object. Displayed on the newspaper is an array of Did You Know?… facts about the street and the time period. I did research on the prominence of clothing,shoe, and hat stores on the streets. Why was fashion so important, and what kind of trends supported this boom of fashion?

In my research I found that during this period, also known as the roaring 20’s fashion for women had drastically changed. Due to the women’s rights movement and the passing of the 19th amendment giving women the right to vote, women began to push the boundaries on what had been traditionally socially acceptable. This included fashion. Instead of the conservative type of dress wear that had been traditionally worn for centuries, or instead of the long braided or put up hair, women had cut their hair short into what was called a bob- style that was barely to their shoulders, and they began to wear flashy knee length dresses. In addition to the now more revealing clothing and the short straight hair, women began to use make-up while previously make-up was associated with prostitutes. Not only was women’s fashion important at the time, but when were also expected to dress to impress. Men wore classic suits with dress shoes and they usually finished off their look with a trendy hat. This was expected from men as to society a  well dressed man in a suit signified wealth and class.

I believe that this boom in fashion and nightlife can be closely correlated to the businesses that lined this infamous street. So much can be found and said from just one clue of information.

I look forward to continue to gain knowledge and experience, through this innovative project!

Until next time,

Alexandra Orrego