Infographic Resume

I have been on the job market since September.

The academic job market takes just short of forever, and is a HUGE commitment. As a result, I have become curious about other job markets and how they work. I essentially know exactly nothing about how to get a job outside academia, despite training for a PhD for the last 5 years. Correction. I knew nothing about the market ‘out there.’

In this blog, I take an industry professional’s resume, and turn it into a cute, easy to read infographic using picktochart, a mostly free online drag and drop application that creates a platform on which you can build an infographic.

What is an infographic?

Customer Magnetism explains it really well, with pictures. Pictures are essential to infographics, as ‘graphic’ is the central part to displaying the ‘info’.

So when Oscar Rieken, Lead Software Engineer and All-Around Awesome Person, asked if I could make his resume into and infographic, I said, “Of course I can. Just tell me what you want featured, and what colors you want.” And we were off. I even got his permission to write about it here!

After we established the rough parameters for what he wanted his resume to display, I set to work making different visualizations that we could choose from.

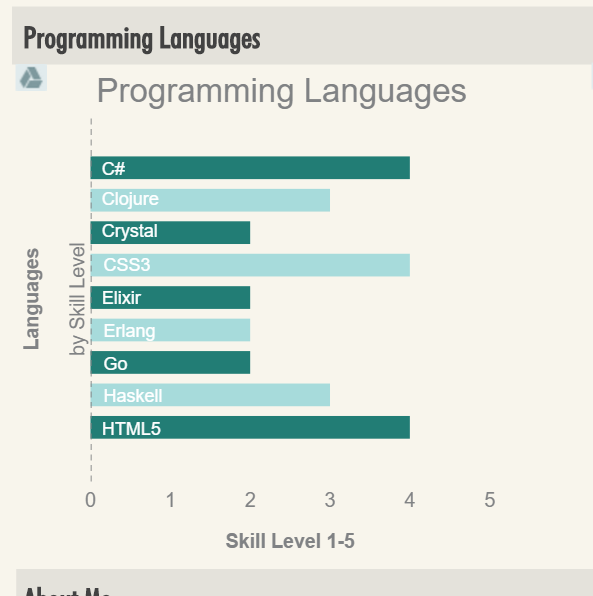
Programming Languages Beta

The above shows the way we decided to display Oscar’s skills, after one or two trials with other charts. Each bar displays languages he knows and the level, (1-5) at which he places himself in experience, with 5 being “nothing left to learn.”

We decided this way, on a basic blue/green color scheme that we used consistently all the way through the infographic.

All of Oscar’s Skills, AND Tools are displayed this way.

Next, and perhaps the most difficult, was deciding how best to display his work experience. Here are some trials we played with:

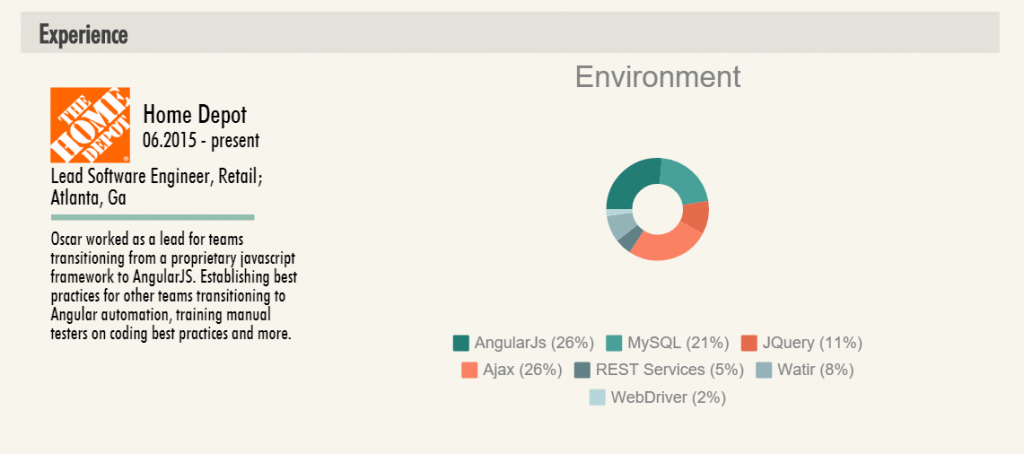
Experience-visual-sample-1

Here, we can see Oscar’s current place of employment, and the skills/tools he uses most at this position. But the circular chart is very difficult to read, and the key is bulky and strange.

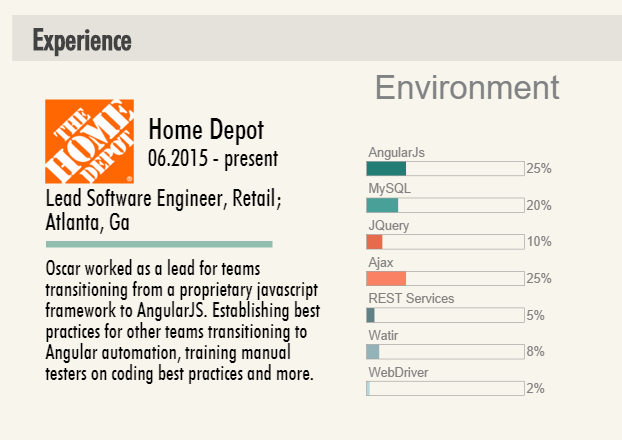
Experience-visual-sample-2

Next I tried displaying them on a similar chart that would visually match his skills and tools above. It looked better, but still didn’t necessarily warrant a display in an infographic.

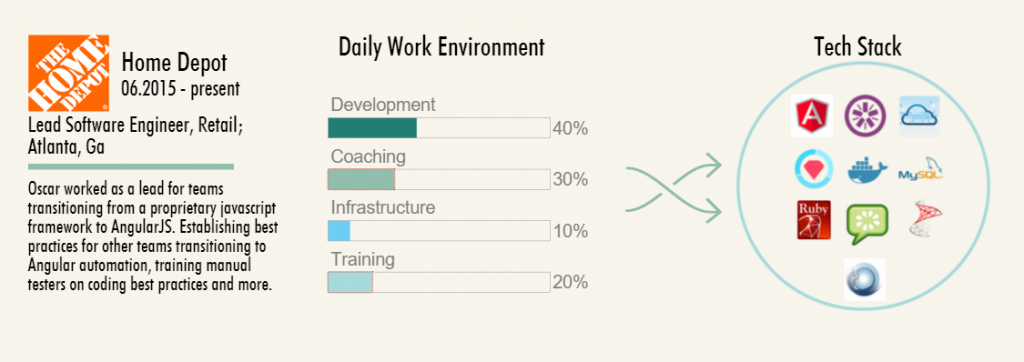
Home-depot-visualization-2

I asked him to split his skills and tools up into the way he spends his typical day. Oscar created a spreadsheet for me with data that indicated that, in his current job, he spends 40% of his day in development, 30% in coaching, and so on. Using powerpoint, I arranged his skills and tools by logo, and put them into a ‘tech stack’ inside a container, which here, is a circle. In earlier jobs, I used the shapes of the states and countries he worked in, which worked to meet Oscar’s visual tastes.

Thoughtworks-Brazil-Tech-Stack


Here, you can see the skills and tools Oscar used when he worked in Brazil. Creating the graphic was incredibly easy, and I just used some simple formatting in PowerPoint to create a .jpg that I could then upload to piktochart and insert into the infographic.

It took a lot of work, and a fair amount of consulting to get this the way Oscar wanted. But eventually we completed it, and he was quite happy with it, especially after I added the little robots as accents. Oscar is really into robots.

Below, is the infographic in its entirety (with full permission).
VisMe Experiment

Over the last two weeks, I have been on campus visits. The campus visit is the last stage of the interview process for those of us staying in academia once we get our terminal degree. One of the steps in the campus visit interview (one of my interviews lasted for 21 hours over 2 days to give you a sense of scope), was to give a scholarly presentation on my own work.

One of my main aims was to use a presentation software that would look clean, and be something that most of the faculty I knew would be present for my presentation had not yet seen a lot. After some research and one trial with a timeline software, I chose VisMe.

Below is a mostly final draft of my presentation. If it works properly, you can push play, or click through it to view it.

The process of using VisMe was interesting, particularly since I didn’t *notice* that it is still in beta when I began. In fact, despite the very clearly noted ‘beta’ attached to the logo, I still missed it, all the way until I was frustrated with the build process.

VisMe-beta-marked

What I DO like about VisMe is the clean minimalist design that is really in at the moment. Each template has a library of pages the user can choose from in order to built a well rounded presentation. The designs are built already to give the user a sense of how a presentation could look, depending on what the presentation material is covering.

And even though the pages are built for you – here is an example:

VisMe-sample-page

You are not required to keep the page this way. As you can see, I altered the template page a lot to fit my needs.

Visme-sample-page-2

As a user, I am able to completely revamp any aspect of any slide that I choose. But I found the template to be a really great guide as a first time user. The end product turned out beautiful, and I was complimented on how clean it looked.

Because VisMe is in beta, it still has a lot of bugs. Among these bugs are the incredible difficulty involved in clicking on text I have created in a text box. Once I created text, and aligned it with other objects, if I found a typo, or wanted to edit, I had to drag the text box away, and then click vigorously and hope that I might somehow land my cursor in the magical spot that would then select the text I wanted to edit. If my apartment neighbors didn’t think I was crazy already, they surely do now. Frustration.

And then of course there are the mystery issues that come with all software. For example, I published my test presentation to see what options would appear once I published. The library of slides disappeared. I had to completely start my presentation over. Of course it turned out better, as many of you have probably experienced for yourselves. But… this problem has only happened one time. I published the above presentation, and none of the same problems persist. Face to palm – I’m feeling a little gaslighted.

The last problem I want to address is that once an animation is applied to text, it cannot be fully deleted. It CAN be altered, but not completely deleted and this led to more frustration and yelling on my part. Because of this issue, I ended up downloading each slide (a publishing feature) and putting the whole thing inside a power point presentation – animation problem solved.

Probably the most interesting part of VisMe is that it exists in the cloud. Since I only played with the free version, I had no access to the cloud editing and sharing capability, but it exists. Of course, my presentation exists in the cloud, and is clearly hosted above that way, which is a viable and relevant part of cloud computing. But in order to access sharing features, I need to pay the monthly business fee, which is not feasible for a scholar who might use this once or twice a year. But knowing it exists is relevant to many of the arguments I am currently making about the work of composing in the cloud – so I may dip back in here for further exploration.

Until then – give it a try if you are in the mood to learn something new that is improving as the company grows.


Tableau Training

Since the beginning of SIF, I’ve been on the Tobacco Ebook project. I have learned iBooks Author layout and design techniques, which has completely reoriented my thinking about how design works, and increased my attention to detail by… a lot.

This week, I got moved from layout and table building within iBooks Author to recreating charts in a program called Tableau. Tableau can create really clean-looking, beautiful line graphs, bar graphs, and many other types of graphs and charts, like pie charts :). But it’s not easy. First, the data in the spreadsheets the book writers provided us with must be formatted in a way that Tableau ‘likes,’ which is a feat all on its own. If the data isn’t formatted properly, nothing works. Then, the chart has so many formatting options, its enough to make any beginner’s head spin.

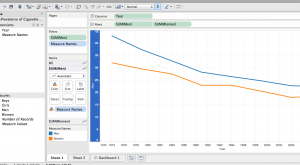
Here are two screen shots of graphs I’ve been working with that I can’t seem to get to combine – one line graph and one bar graph:

Tableau line graph

Tableau Bar Graph

The good news is that once I figure out how to make the graphs function the way I like, they are actually pretty easy to make and turn out well. Thankfully, Will knows how to do most of it and is helping me figure out the trickier aspects. Phew!

Digital Archive of Literacy Narratives (DALN)

One of the projects I am assigned to is to help Dr. Michael Harker work on the Digital Archive of Literacy Narratives (DALN). The DALN, as we refer to it, is a collection of narratives from all over the world about literacy. This could mean anything from reading, to writing, and even to digital literacy.

I have helped with the DALN in the past, (wo)manning tables at conferences, enticing potential storytellers to our table to get them to speak their narratives into a computer. We then store all these narratives at the link above. Anyone can look into the archive. Anyone can use the archive to do any kind of research they may have relating to literacy, or even beyond.

This week, I’ve been spending hours uploading narratives to the archive that were sent to us on a drive all the way from Singapore. Many of these are about learning English, but some are about speaking Mandarin, Idioms, and several are about computing.

I am the only person on this project. Once I upload the rest of the files from Singapore, I’ll be playing with an IPad 2, trying to figure out a better way to collect narratives at later conferences. Hopefully I’ll have plenty to say about that project in later posts. 🙂