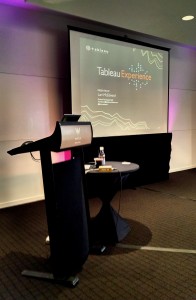
Today I attended “The Tableau Experience.” I’ve been struggling with what to call it: a conference, a convention… It had only one speaker, and a Q&A – and a wet-bar. So… I’m settling with ‘experience’ as they do. What it really was though, was an advertisement.
Don’t get me wrong – I like using Tableau to recreate charts for the Tobacco Ebook I’m working on, and this ‘experience’ was worth it for several reasons:
1. The speaker demoed several ways to share data that I haven’t seen in action since I’ve only been using it to create charts for data sets that are already created for me.
2. There were a lot of people there from many different kinds of institutions. I met others from universities like me – Georgia Tech, Gwinnett College, and so on. But I spent most of the time schmoozing with a lady from Home Depot, and then talked briefly to a man from a company called Norfolk. Everyone was using Tableau for something different – I’m pretty sure I was the only one making an Ebook.
3. I was able to ask about that pesky issue Ryan Cagle and I have been having in trying to get the distance between pane tick marks and labels to be exactly the same in all our charts so they’re uniform within the Ebook. Sorry, Ryan – there is no way to do this. The guy I asked said your idea was the smartest.
Overall, I’m glad I went to the Tableau Experience. And so I leave you with a picture of my spoils, the swanky bathroom in the wetbar, and the view from the 16th floor. Enjoy:


