Category: Data Visualization

Some Data on our Research Data Services

The Library’s Research Data Services (RDS) Team supports research projects and learning across multiple disciplines involving quantitative, qualitative, business, and spatial/GIS data. We collaborate with and advise Georgia State University’s researchers across the entire research lifecycle, including accessing and using unique data, using data analysis software, managing data, and sharing data for reuse by other researchers. Find out more about our specific services at http://library.gsu.edu/data.

In our inaugural year (FY17), the Research Data Services Team, led by Mandy Swygart-Hobaugh, provided over 250 consultations to Georgia State University’s researchers. Check out some statistics and visualizations, generated here by Mandy in Tableau from the data we logged for our research data services (RDS) consultations, which illustrate the breadth and depth of our experiences during our inaugural year.
Students: Enter a Data Viz in Tableau’s Data Viz Assignment Contest!

Students: Been using Tableau for data visualizations, or want to try it out? You can enter this contest and maybe win a Tableau swag bag!

To enter the Contest, complete the following steps – entry deadline is May 30:

  1. If you do not already have a copy, download the software at https://public.tableau.com/s/ (a free trial copy is available),
  2. Produce and publish a Tableau data visualization to your Tableau Public profile, and
  3. Provide a link to the visualization on your Tableau Public profile to https://public.tableau.com/s/Student-Viz-Assignment-Contest – Your Submission must be publicly accessible and available at all times during the Contest Period. All Submissions must comply with all Tableau terms and conditions of use, available at http://www.tableau.com/tos.

Tableau is available on all of the University Library’s CURVE computers, and we have Research Data Services Team members who can assist you in using it.

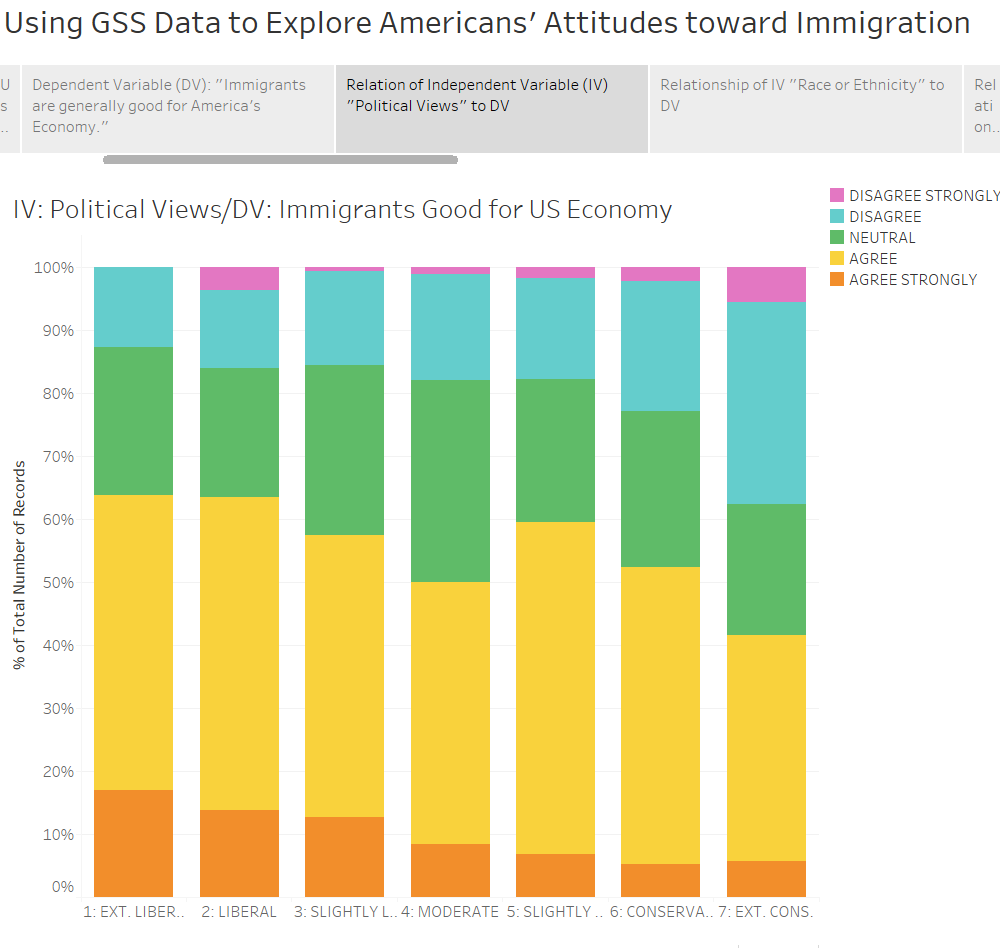
Tableau data viz showing relationship of political views to opinion re: whether “immigrants are good for the American economy.” Click image to go to interactive Tableau Story to explore more variables…

CURVE Hosts the WIT Girls for STEM Career Event

On a Thursday evening last week, CURVE hosted a group of exceptional young women interested in STEM fields. The high schoolers are part of an organization called WIT, or Women In Technology, which “passionately supports women at every stage of their STEM careers—from the classroom to the boardroom,” according to the WIT website. The girls participate in activities and tours sponsored by Atlanta universities and businesses that focus on careers in science, technology, engineering, and math.


At the “Building Your Professional Toolbox” event, sponsored by GSU’s Center for Excellence in Teaching and Learning, the WIT girls rotated through learning stations featuring different technology and career information. Some of the highlights included activities led by GSU librarians in their academic specialties.

Mandy Swygart-Hobaugh, Librarian for Sociology, Gerontology, and Data Services, showcased data science careers by demonstrating how to map and visualize Twitter data with Tableau and NVivo.

Swygart-Hobaugh demonstrates data visualization features in Tableau on the CURVE interactWall

Business Data Services Librarian Ximin Mi took the students on a worldwide vacation through a combination of Google Maps and a Vive virtual reality headset, and discussed the future of virtual reality, computer science, and tech jobs.

Mi shows how to put on the Vive headset using a face mask

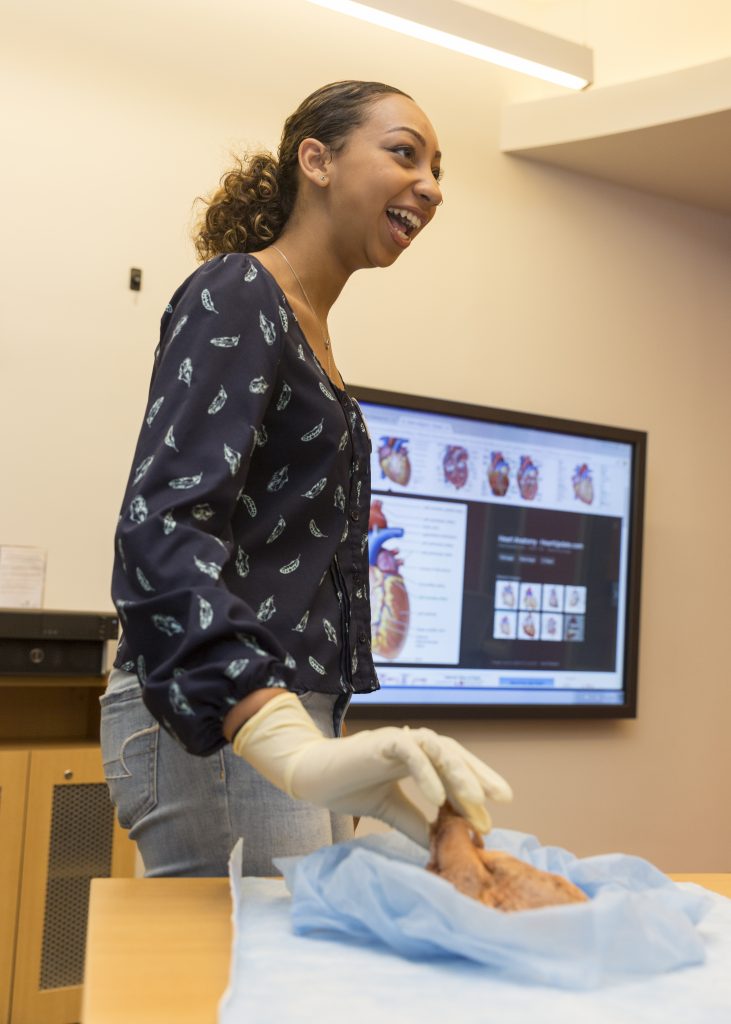
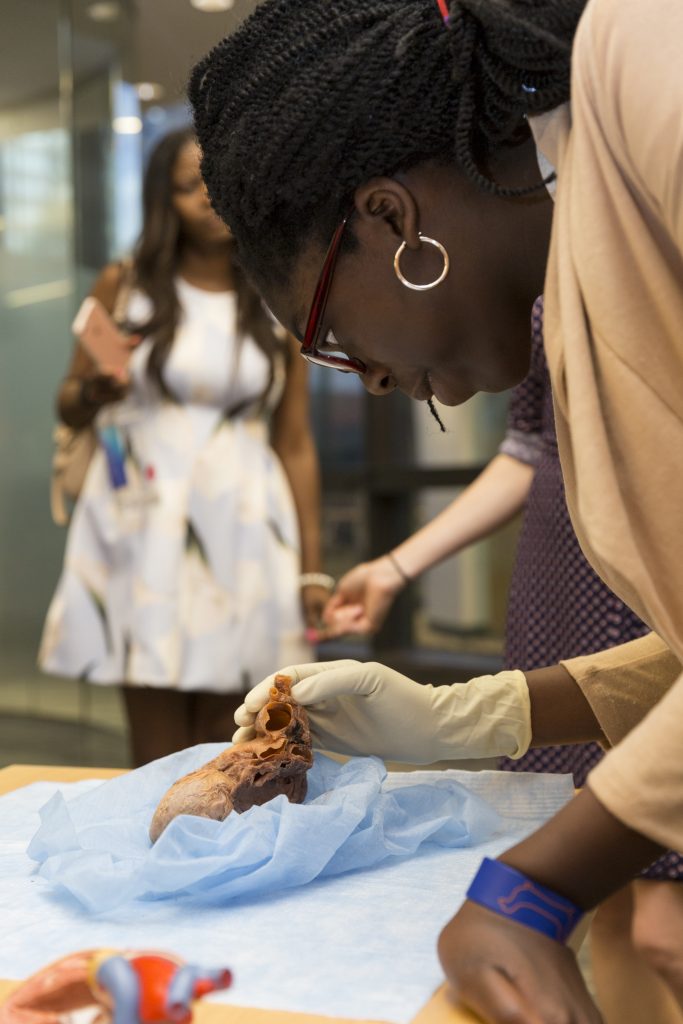
Kelsey Jordan, Librarian for Biology, Chemistry, Neuroscience, and Biomedical Sciences, led a “live” drawing workshop on medical illustration and health careers, featuring a real human heart, liver, and kidneys.

Jordan introduces some examples of medical illustration

Student Innovation Fellows Showcase on Feb. 15

Congratulations to Dr. Brennan Collins, students, faculty, and staff for putting on a great show on February 15 in CURVE, celebrating the work of GSU Student Innovation Fellows (SIFs). The Student Innovation Fellowship Program allows students to develop expertise and share ideas around emerging technologies and instructional innovations, with particular attention to enhancing learning and research at Georgia State through the innovative use of technology.

Attendees, around 50 in all, where invited to: