ABOUT:
Tableau Software is a powerful collection of data analytic tools that is useable to anyone with big data. It is an interactive platform to show data, collaborate research, and find trends in statistical and methodological ways. Sharing data over the cloud makes it easy to present data to anyone with a computer, and Tableau’s wide platform support makes it easy to use any device to collaborate on projects.
Supported
Tableau is supported on Mac and Windows, with tablet support.
Pros
- Easy to use tool to handle big data
- Can be embedded for use on a project website
- Features a wide array of tools to sort and filter through data
- Can be integrated for huge amounts of data, including server support
Cons
- There is a learning curve, but Tableau provides tutorials on their website.
- Must get used to using spreadsheets for accurate data analysis
- Individual accounts on other computers outside GSU’s CURVE costs money.
Examples
Tableau’s wide offering of support tools and interactive data analysis makes it easy to understand and learn about trends.
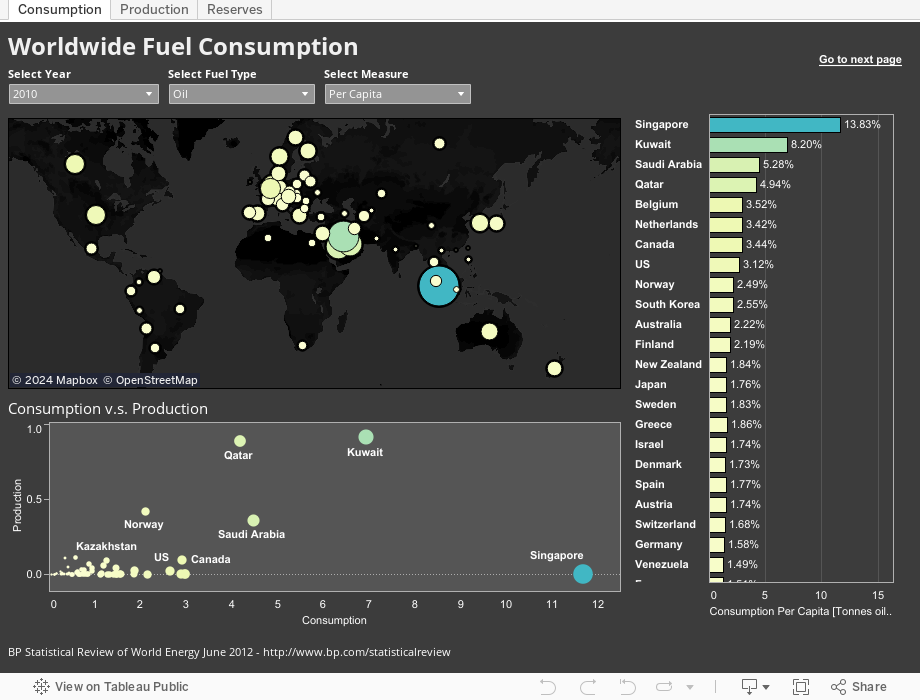
A live version of Tableau at work. Go ahead and explore the data!
Uses
Tableau’s main use is to construct business projections, markets, and trade values, but the gallery shows a great variety of uses by many different research groups. Use it for regional projects about specific country statistics or the entire world, and show the different levels that come with data analysis. Highlight correlations, details, and instances all on the same page with just a click of a button.