Larger-scale Photogrammetry at CURVE

During the spring semester, I acquired a clay whisky jug from the Phoenix Lab, which contains artifacts recovered from the excavation of MARTA lines in the 1970s. Dr. Robin Wharton has worked with students in her multimodel composition course to scan and model objects from the collection, and discussed the process in Atlanta Studies. In this case, the purpose was to experiment with photogrammetry for larger objects, testing the equipment and software that the Library has acquired. The jug is roughly 8 inches high and 6 inches in diameter, with a circumference of 19 inches.

image of whisky jug
Whisky Jug

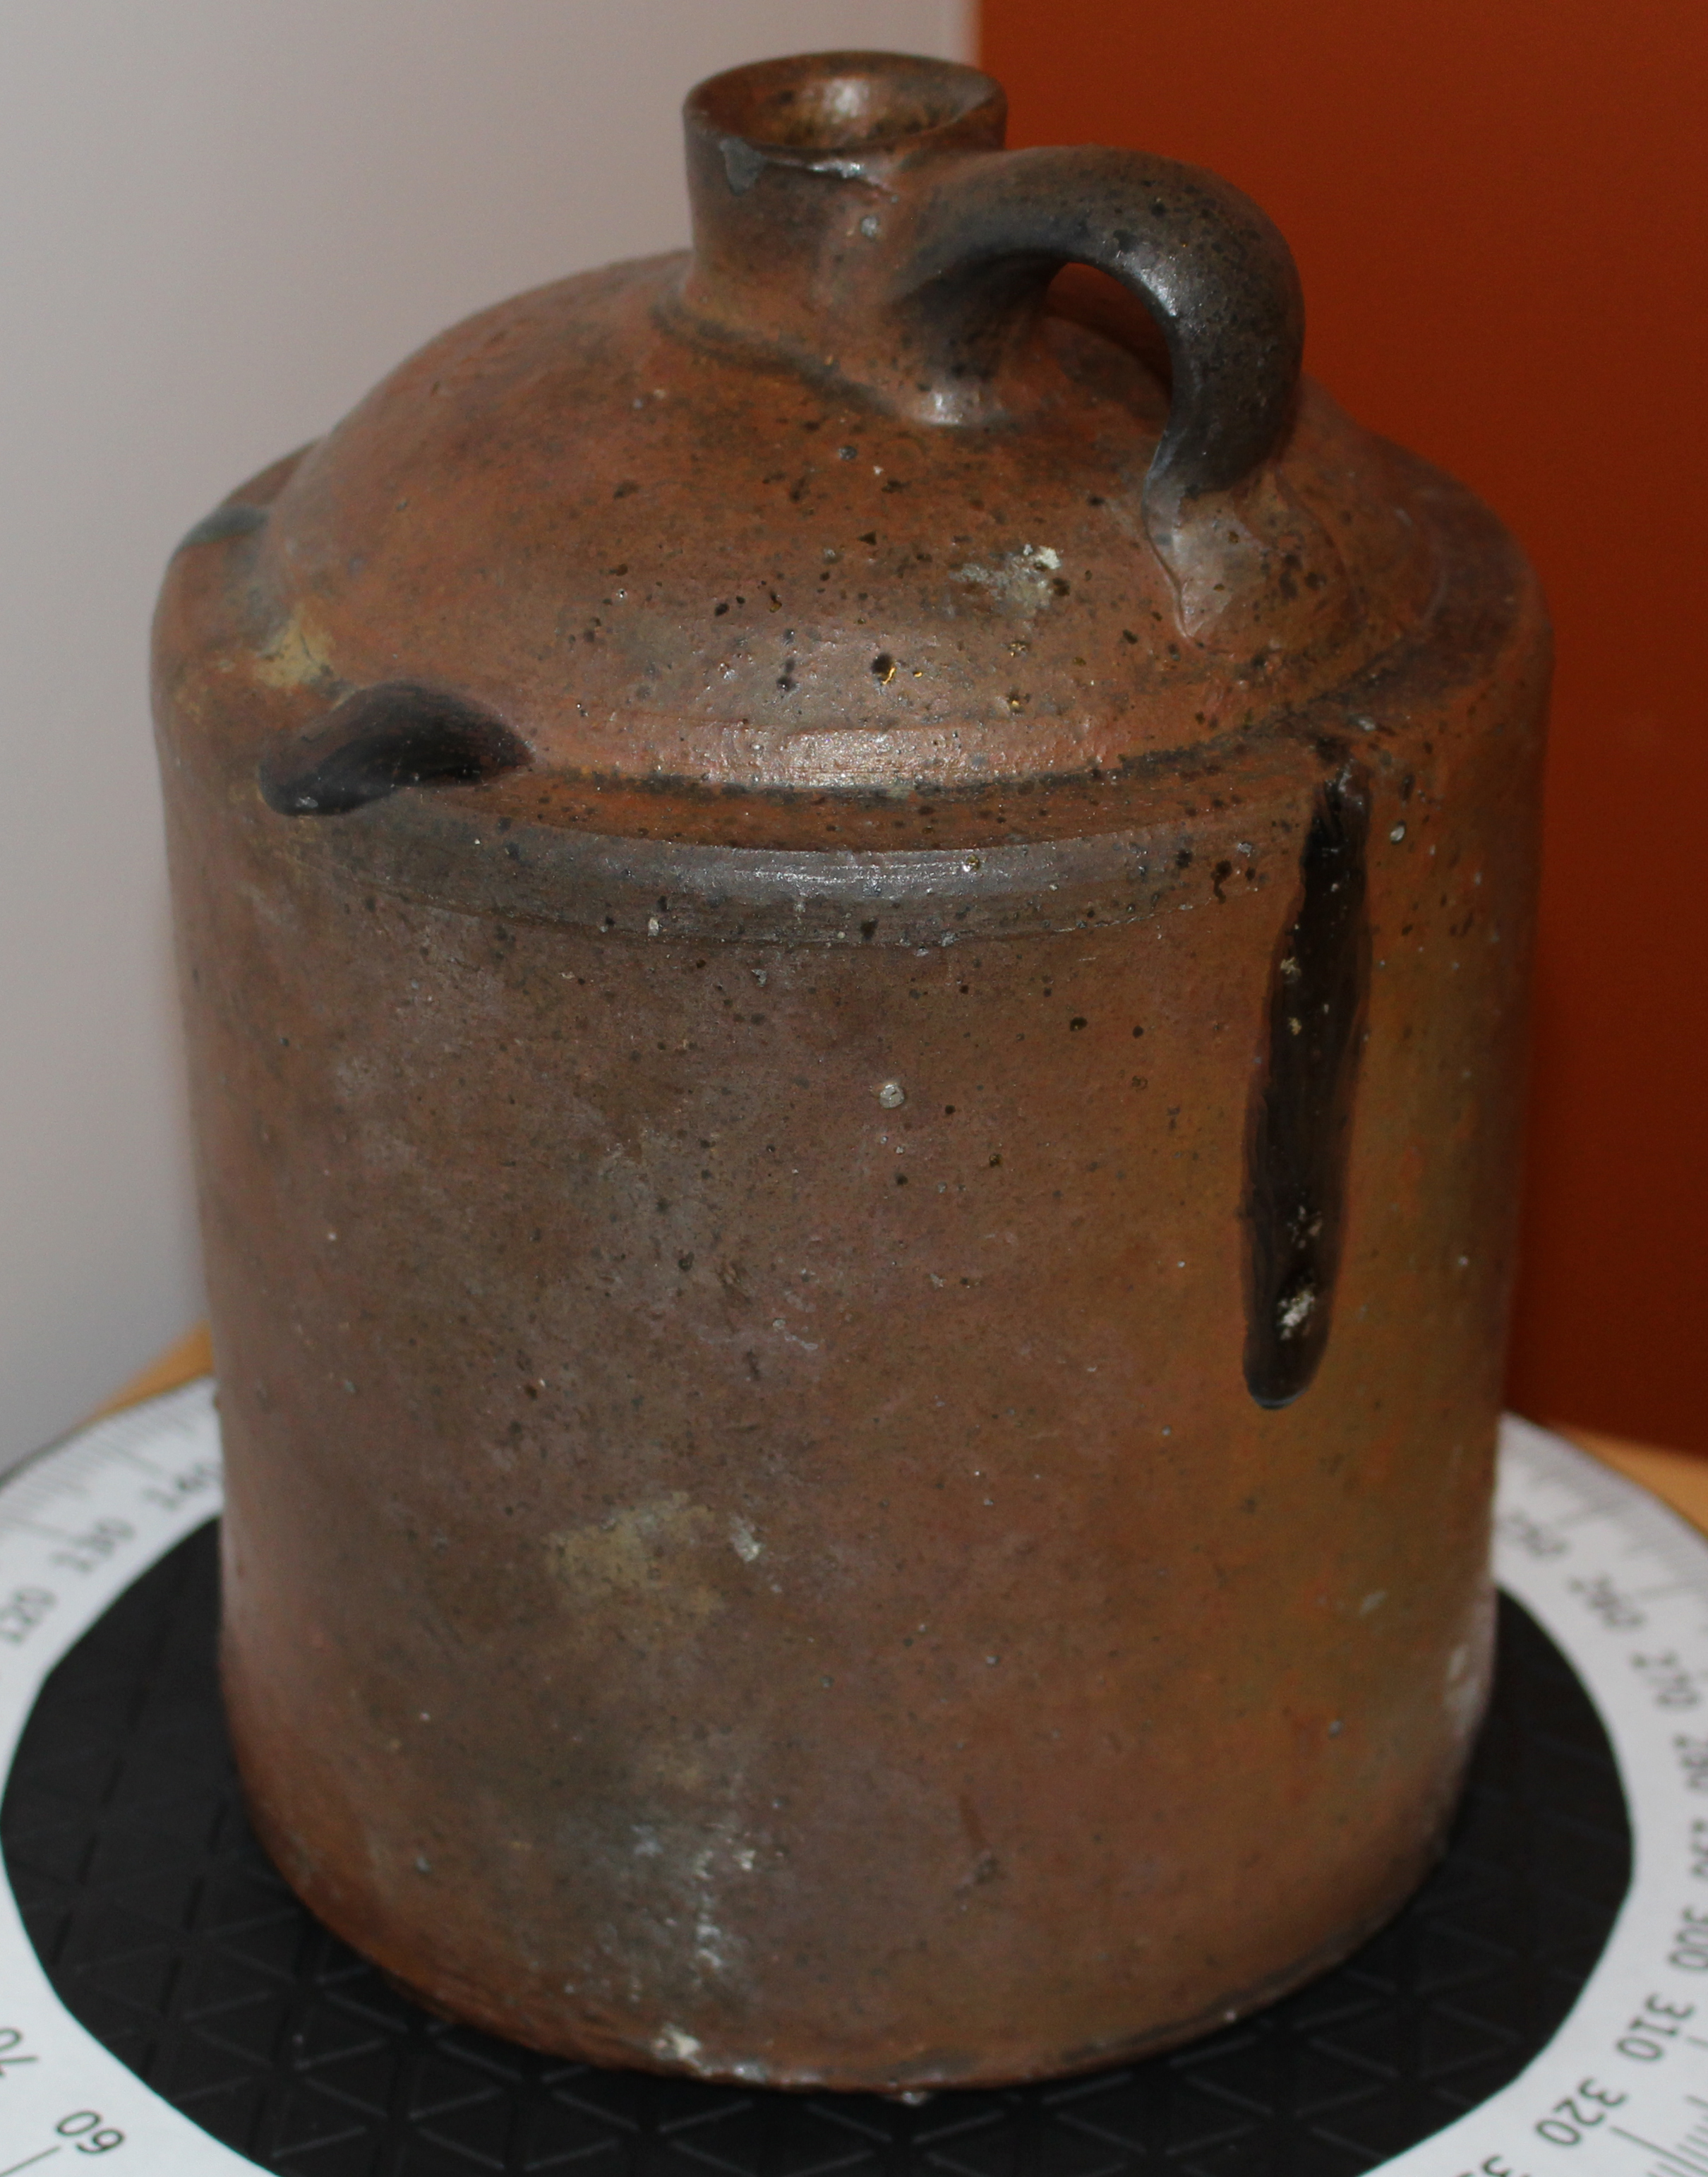
The jug wears the story of its life. The outside is worn and pitted, and carries a few kiln drips, where the kiln bricks melted and dripped on to the jug as it was fired. These drips show as dark splotches on the outside of the jug. Stamped on the top shoulder of the jug are two names: T.W. Cofield and E.C. Brown.

Whisky jug with stamp showing T.W. Cofield and E.C. Brown
Stamp showing T.W. Cofield and E.C. Brown

To capture the entire jug in detail, I took images of the jug at 15 degree intervals on three elevations. I used Agisoft Photoscan to assembled the images into point clouds, meshes, and then textured models. I then pinned the three partial sections together, which resulted in a full model of the jug.

In the finished 3D model, you can manipulate the jug to see its details and textures, including the stamped inscription with the two potters’ names.

Click here to see the Whisky Jug on SketchFab

Thomas William Cofield and Edward C. Brown were cousins who lived in the Howell’s Mills area in northwest Atlanta, near present-day Buckhead. Edward’s father was Bowling P. Brown, a potter. His grandfather was Bowling Brown, also a potter, who had moved the family from Jugtown (an unofficial name) on borders of Upson and Pike counties.

Bowling’s daughter (and B.P.’s sister) Mary Jane Brown married Thomas B. Cofield from North Carolina while they lived in Jugtown. Their son, Thomas W. Cofield, became a potter and worked alongside his cousin, E.C. Brown, to produce jugs for Atlanta’s businesses from the 1880s through the 1910s. [Note 1]

In his history of Georgia’s folk pottery, John A. Burrison suggests that Thomas and Edward worked together no later than 1911, after which Edward “became a gardener (and later foreman) at Grant Park.” Based on this suggestion, we can infer that the whisky jug is at least 106 years old. The jug is in remarkable shape for its age, but I still wouldn’t recommend drinking from it.


Notes

  1. John A. Burrison, Brothers in Clay: The Story of Georgia Folk Pottery (Athens, GA: University of Georgia Press, 2008), pp. 71, 168, 191, 195, 199.
  2. Ibid., p. 195.

[This article has been cross-posted from swroberts.ca]

Students: Enter a Data Viz in Tableau’s Data Viz Assignment Contest!

Students: Been using Tableau for data visualizations, or want to try it out? You can enter this contest and maybe win a Tableau swag bag!

To enter the Contest, complete the following steps – entry deadline is May 30:

  1. If you do not already have a copy, download the software at https://public.tableau.com/s/ (a free trial copy is available),
  2. Produce and publish a Tableau data visualization to your Tableau Public profile, and
  3. Provide a link to the visualization on your Tableau Public profile to https://public.tableau.com/s/Student-Viz-Assignment-Contest – Your Submission must be publicly accessible and available at all times during the Contest Period. All Submissions must comply with all Tableau terms and conditions of use, available at http://www.tableau.com/tos.

Tableau is available on all of the University Library’s CURVE computers, and we have Research Data Services Team members who can assist you in using it.

Tableau data viz showing relationship of political views to opinion re: whether “immigrants are good for the American economy.” Click image to go to interactive Tableau Story to explore more variables…

CURVE Hosts the WIT Girls for STEM Career Event

On a Thursday evening last week, CURVE hosted a group of exceptional young women interested in STEM fields. The high schoolers are part of an organization called WIT, or Women In Technology, which “passionately supports women at every stage of their STEM careers—from the classroom to the boardroom,” according to the WIT website. The girls participate in activities and tours sponsored by Atlanta universities and businesses that focus on careers in science, technology, engineering, and math.


At the “Building Your Professional Toolbox” event, sponsored by GSU’s Center for Excellence in Teaching and Learning, the WIT girls rotated through learning stations featuring different technology and career information. Some of the highlights included activities led by GSU librarians in their academic specialties.

Mandy Swygart-Hobaugh, Librarian for Sociology, Gerontology, and Data Services, showcased data science careers by demonstrating how to map and visualize Twitter data with Tableau and NVivo.

Swygart-Hobaugh demonstrates data visualization features in Tableau on the CURVE interactWall

Business Data Services Librarian Ximin Mi took the students on a worldwide vacation through a combination of Google Maps and a Vive virtual reality headset, and discussed the future of virtual reality, computer science, and tech jobs.

Mi shows how to put on the Vive headset using a face mask

Kelsey Jordan, Librarian for Biology, Chemistry, Neuroscience, and Biomedical Sciences, led a “live” drawing workshop on medical illustration and health careers, featuring a real human heart, liver, and kidneys.

Jordan introduces some examples of medical illustration

Human Anatomy 3D Showcase

On April 12, students in Dr. Carmen Eilertson’s Biology 4687/6687 Surgical Anatomy demonstrated some of the  3D models of human organs they have created this semester using the NextEngine laser scanner in CURVE’s 3D Modeling Lab.  Here, they are presenting 3D models of a human kidney, brain, and lung.


This was followed by a lesson in understanding computerized tomography (CT)  scans, which the interactWall can display in amazing detail for up-close analysis.