Consider this set of relationships: You put money in a savings account. That money gains interest, which causes the amount of money in your savings account to increase … which causes the amount of interest you gain on your savings account to increase … which … you get the idea. The product of one process feeds back on that process causing it to increase or be enhanced. This is the idea of a positive feedback loop.
Without two positive feedback mechanisms the ice would not have kept advancing from 116,000 years ago to the Last Glacial Maximum. The two positive feedback mechanisms are ice-albedo feedback and greenhouse-gas concentrations. Ice-albedo feedback in the context of glaciation works as follows: cooling tends to increase snow and ice cover and thus the albedo, thereby reducing the amount of solar energy absorbed and leading to more cooling. This video can help explain the topic in the opposite direction (i.e. warming and decrease of snow and ice cover). You learned in the Global Surface Temperature lab that a small increase or decrease in greenhouse-gas concentrations can cause relatively large changes in the global surface temperature. CO2 concentrations can change dramatically between peaks in interglacial periods and peaks in glacial periods due to changes in oceanic processes. For example, CO2 is more soluble in colder waters than in warmer waters. Examine the picture below, which shows changes in temperature and CO2 concentrations at Antarctica over approximately the past 400,000 years.
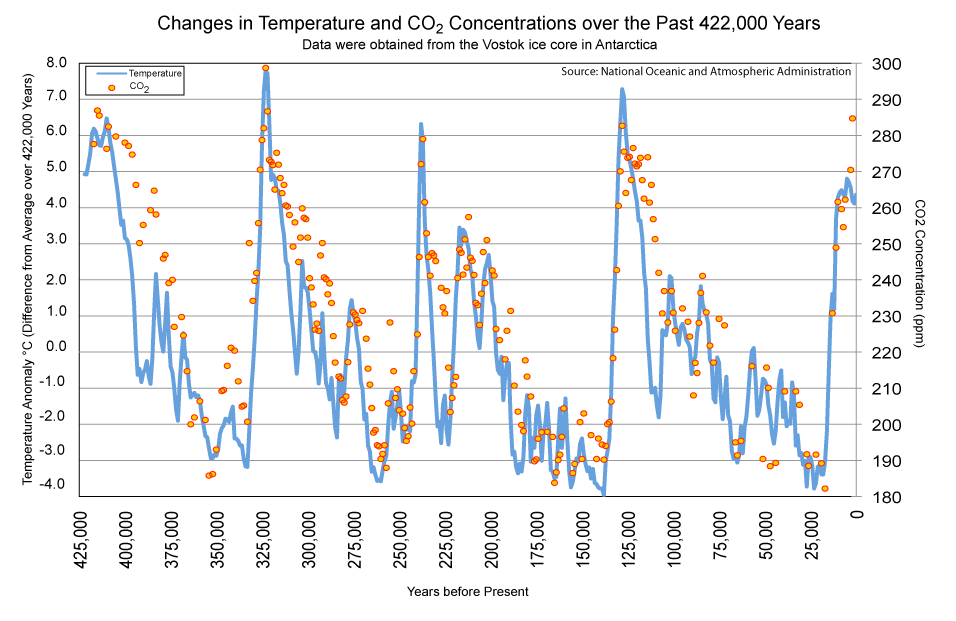
![]() Q21: What is the relationship between temperature and CO2 concentrations during glacial-interglacial cycles?
Q21: What is the relationship between temperature and CO2 concentrations during glacial-interglacial cycles?
![]() Q22: What is the difference in CO2 concentrations between maximums in interglacial periods (i.e. peaks in the graph) and maximums in glacial periods (i.e. valleys in the graph)?
Q22: What is the difference in CO2 concentrations between maximums in interglacial periods (i.e. peaks in the graph) and maximums in glacial periods (i.e. valleys in the graph)?
![]() Q23: Why do atmospheric CO2 concentrations increase and decrease so much during glacial-interglacial cycles?
Q23: Why do atmospheric CO2 concentrations increase and decrease so much during glacial-interglacial cycles?
Click LGM_Animation to visualize the retreat of ice sheets from the Last Glacial Maximum (21,000 years ago or 19,000 B.C.) to the present. This visualization was developed at the Zurich University of Applied Sciences. Snow and ice cover at the end of the summer is shown. Please note that retreat of ice sheets occurs at a glacial pace: you will notice in the animation that the ice sheet moved just 100 meters — which is about the length of a football field — per year as it was retreating from present-day central Indiana to the present-day border of the United States and Canada. The yellow line shows the actual shoreline. Also shown in the animation are CO2 concentrations, average global temperature, sea level, and the global population.
![]() Q24: Compared to the present-day global average temperature, how much lower was the global average temperature 21,000 years ago?
Q24: Compared to the present-day global average temperature, how much lower was the global average temperature 21,000 years ago?
![]() Q25: How much did CO2 concentrations increase from 21,000 years ago to 1500 A.D?
Q25: How much did CO2 concentrations increase from 21,000 years ago to 1500 A.D?
![]() Q26: Why have CO2 concentrations increased by at least another 100 ppm from 1500 A.D. to the present?
Q26: Why have CO2 concentrations increased by at least another 100 ppm from 1500 A.D. to the present?
Click LGM to view in Google™ Earth the extent of ice and other types of land cover during the Last Glacial Maximum. The product is part of a larger project by the Zurich University of Applied Sciences. Focus on the Northern Hemisphere and notice just how far south the ice sheets extended. The ice sheet that covered Canada and parts of the United States is the Laurentide Ice Sheet. It may have been up to 3 km thick over northeastern Canada, but it was much thinner at its edges. As noted earlier, the climate was much different 21,000 years ago than it is today. The NASA Web site http://earthobservatory.nasa.gov/Features/BorealMigration/boreal_migration3.php shows the prevalence of various types of trees over the United States from 21,000 years ago to the present. For example, much of the eastern United States that wasn’t under the Laurentide Ice Sheet was boreal forest; the boreal forest is now restricted mostly to high-latitude areas.
![]() Q27: Why was the sea level so low? If the water wasn’t being stored in the oceans, where was it being stored?
Q27: Why was the sea level so low? If the water wasn’t being stored in the oceans, where was it being stored?
![]() Q28: How did the low sea level affect coastlines and how did that in turn affect the surface albedo of the planet? Hint: Look at Florida and turn off and on the Last Glacial Maximum layer.
Q28: How did the low sea level affect coastlines and how did that in turn affect the surface albedo of the planet? Hint: Look at Florida and turn off and on the Last Glacial Maximum layer.

