Before beginning the lab, please watch the short video below. Mila is going to introduce the topic, show you some existing misconceptions you might have, and then end the video by reminding you of the three research questions you should be able to answer at the end of the lab.
This lab has 21 short-answer questions you will answer prior to the three big questions (i.e., research questions) Mila has noted above.
Section 1
We look up at the sky on a clear day to see a bright yellow sphere that we know is the Sun. We all have a sense of how important that ball of fire is to us: It is, after all, the primary source of energy for our planet. But do we really understand how that energy is received by the Earth and how that affects our world and our lives?
At the end of this lab, you should be able to answer the following research questions:
-
Why do seasons occur?
-
Why does summer in the Northern Hemisphere occur when Earth is farthest from the Sun?
-
Not considering tropical areas, what is the general relationship between latitude, solar radiation, and surface temperature?
__________________________________________________________________________________________
Entering with the right mindset
Throughout this lab you will be asked to answer some questions. Those questions will come in three different varieties:
![]() Fact-based question →This will be a question with a rather clear-cut answer. That answer will be based on information (1) presented by your instructor, (2) found in background sections, or (3) determined by you from data, graphs, pictures, etc. There is more of an expectation of you providing a certain answer for a question of this type as compared to questions of the other types.
Fact-based question →This will be a question with a rather clear-cut answer. That answer will be based on information (1) presented by your instructor, (2) found in background sections, or (3) determined by you from data, graphs, pictures, etc. There is more of an expectation of you providing a certain answer for a question of this type as compared to questions of the other types.
![]() Synthesis-based question → This will be a question that will require you to pull together ideas from different places in order to give a complete answer. There is still an expectation that your answer will match up to a certain response, but you should feel comfortable in expressing your understanding of how these different ideas fit together.
Synthesis-based question → This will be a question that will require you to pull together ideas from different places in order to give a complete answer. There is still an expectation that your answer will match up to a certain response, but you should feel comfortable in expressing your understanding of how these different ideas fit together.
![]() Hypothesis-based question → This will be a question which will require you to stretch your mind little bit. A question like this will ask you to speculate about why something is the way it is, for instance. There is not one certain answer to a question of this type. This is a more open- ended question where we will be more interested in the ideas that you propose and the justification (‘I think this because . . .’) that you provide.
Hypothesis-based question → This will be a question which will require you to stretch your mind little bit. A question like this will ask you to speculate about why something is the way it is, for instance. There is not one certain answer to a question of this type. This is a more open- ended question where we will be more interested in the ideas that you propose and the justification (‘I think this because . . .’) that you provide.
__________________________________________________________________________________________
Section 2
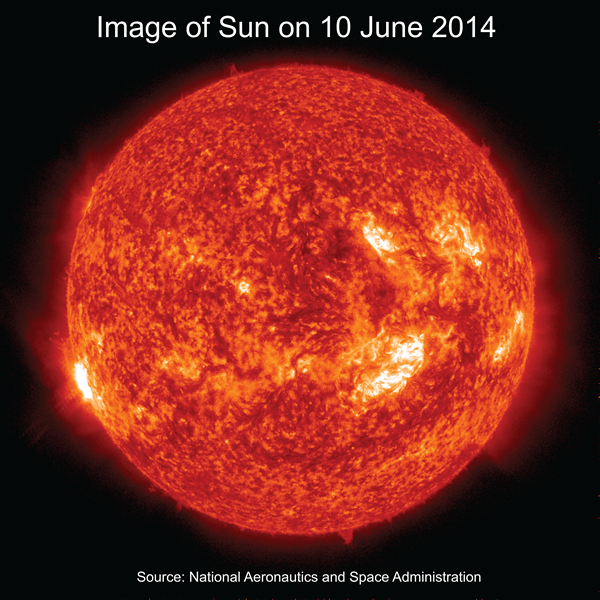
The Sun is the primary source of energy for the Earth’s climate system. The Sun is huge and hot: it has a diameter of approximately 1,400,000 km, and it has an average surface temperature of approximately 5,500° C. For comparison purposes, the Earth has a diameter of approximately 12,700 km and an average surface temperature of 14° C. Therefore, the Sun’s diameter is 109 times larger than Earth’s diameter and the Sun is nearly 400 times hotter than Earth. The Sun’s extremely high temperature means that it emits an enormous amount of radiation: the luminosity (the total amount of energy emitted) of the Sun is 3.846 x 1028 W. The law that explains this is known as the Stefan-Boltzmann Law (i.e., total energy radiated increases exponentially with an increase in temperature), and you have without a doubt been exposed to law in the lecture portion of this course.
The white areas on the image of the Sun above are temporary phenomena known as sunspots, and the more sunspots the Sun has the more radiation it emits.
![]() Q1: What controls how much radiation the Sun emits? Sunspots are not the primary control.
Q1: What controls how much radiation the Sun emits? Sunspots are not the primary control.
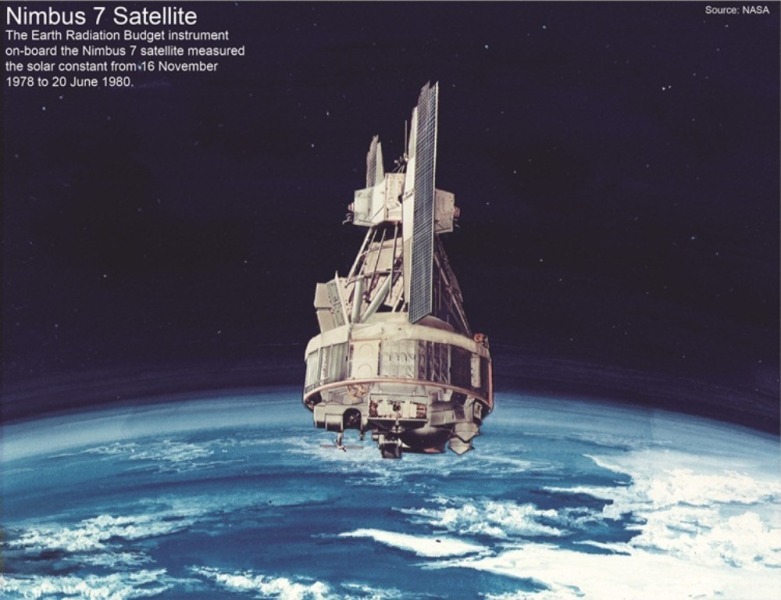
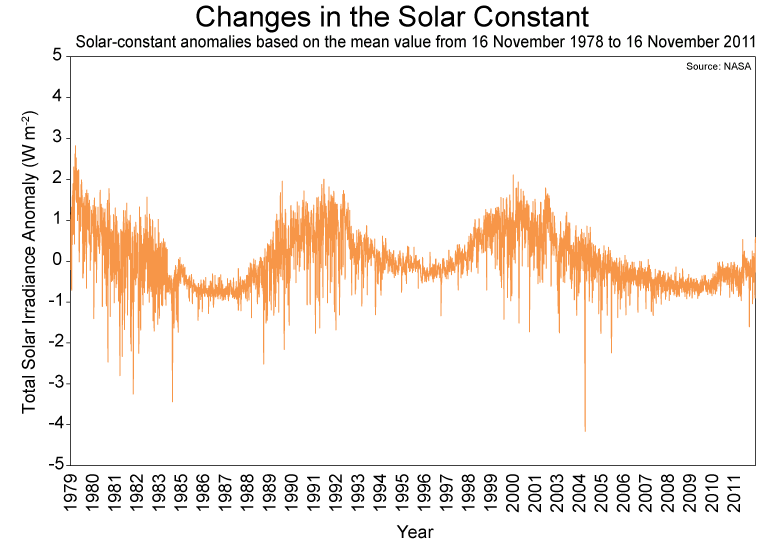
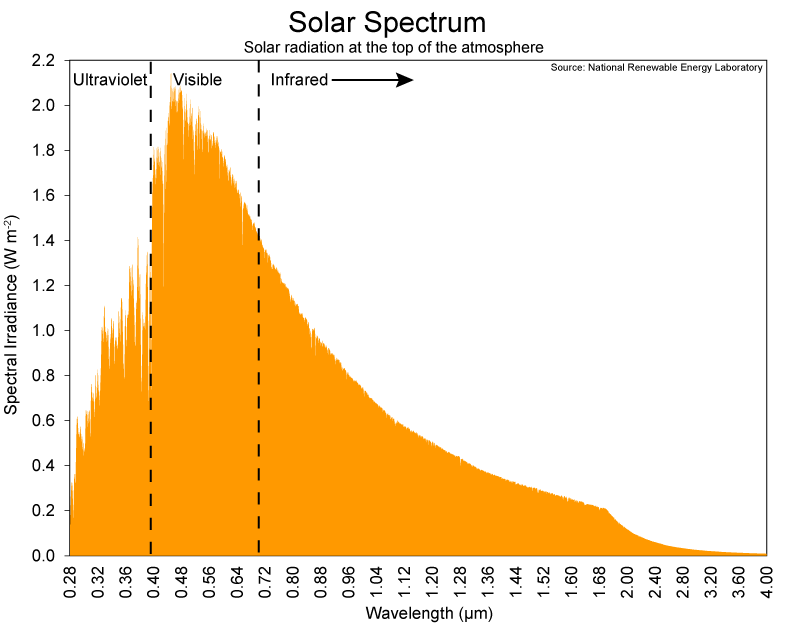
The distance from the Sun to the Earth is approximately 150 million kilometers; at this distance, Earth intercepts a tiny amount of the radiation emitted by the Sun. The law that explains this is known as the Inverse Square Law. Just above the Earth’s atmosphere, the average amount of solar energy intercepted by a surface perpendicular to the sunlight is approximately 1,367 W m-2. This value is known as the solar constant. Instruments on-board NASA satellites have been measuring the solar constant since 1978; click on the left-hand image below to see an example of such a satellite. Next to the satellite image is a graph showing changes in the solar constant. You should notice that the value for the solar constant changes from year to year, but you should also recognize a long-term pattern in the values which repeats approximately every eleven years; this is the solar cycle and what it shows is the semi-regular cycle of the number of sunspots on the Sun. As noted earlier, more sunspots causes the Sun to emit more radiation. The third image below is a graph of the solar spectrum, which shows a breakdown of the radiation making up the solar constant. Most of the solar radiation is in the visible, near-infrared, and ultraviolet portions of the electromagnetic spectrum; a representation of the electromagnetic spectrum is the fourth picture in the set below.
![]() Q2: Does the Sun emit more ultra-violet radiation or visible radiation?
Q2: Does the Sun emit more ultra-violet radiation or visible radiation?
At the present time, Earth’s axis of rotation is tilted 23.5 °away from the perpendicular to its orbital plane. This is what causes changes in solar radiation received by locations on Earth over the course of a year. Examine the image below to visualize this tilt. The fact that the Earth’s axis is tilted is a major reason why we have seasons. It takes one day for Earth to complete a full rotation, and the Earth orbits around the Sun, which is typically 150 million kilometers away, once every 365.2564 solar days (i.e. one year). The axis remains tilted in the same direction towards the stars (particularly the North star Polaris) throughout a year. The tilt causes day to day changes in the duration and intensity of solar radiation at all latitudes.
![]() Q3: To what celestial body is the tilt axis always pointed throughout the year?
Q3: To what celestial body is the tilt axis always pointed throughout the year?
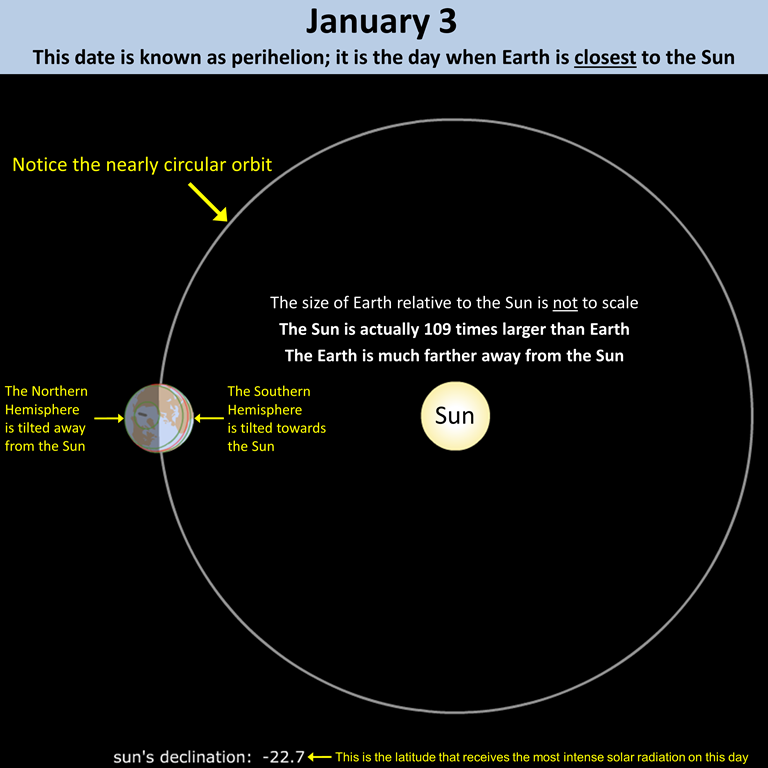
The images below show the position of the Earth relative to the Sun on two dates: January 3 and July 4. Since Earth’s orbit around the Sun is elliptical (yet nearly a perfect circle), Earth is closest to the Sun on January 3 and farthest from the Sun on July 4. The distance from the Earth to the Sun on January 3, which is known as perihelion, is 147,098,290 km. The distance from the Earth to the Sun on July 4, which is known as aphelion, is 152,098,232 km. therefore, there is only a 3.4% difference in Earth-Sun distance between perihelion and aphelion. Throw in the fact that aphelion occurs during the Northern Hemisphere summer and it becomes obvious that the changing distance from the Earth to the Sun is not the cause of seasons.
If you are doing your lab on your own computer, this part of the lab requires the downloading and installation of software. We used to rely on Adobe Flash for performing simulations of seasons, but Flash was discontinued in December 2020. Please go to https://astro.unl.edu/nativeapps/ and download NAAP Labs – v1.1.msi if you have a PC or download NAAP Labs – v1.1.pkg if you have a Mac. Don’t worry, a degree in computer science is not needed to download and install these applications. This video guides you through downloading and installing the .msi file (if you have a PC), and this video guides you through downloading and installing the .pkg file (if you have a Mac). After you have downloaded the file, just click on it and let your operating system do the rest. After it has been installed, you should have an application called NAAP Labs on your computer. Your friends and family will be very jealous.
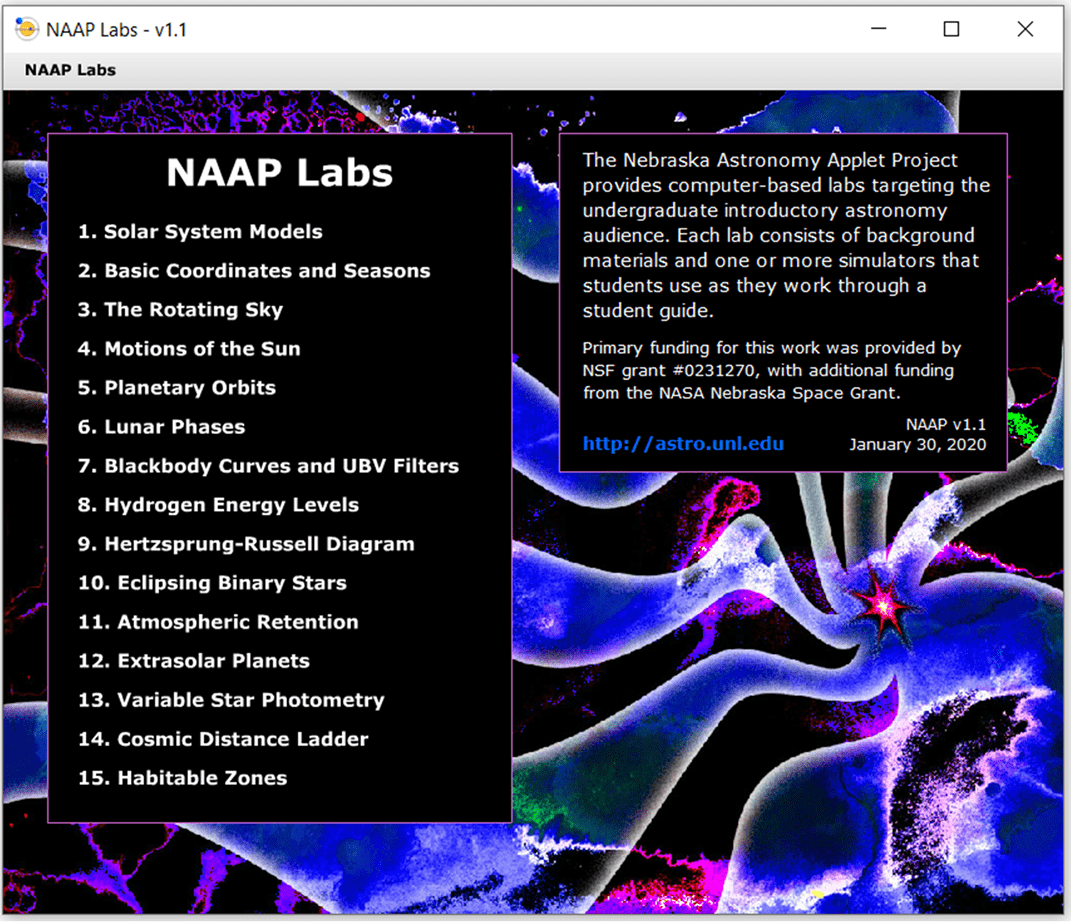
The application will look like this.
Click Basic Coordinates and Seasons. You will get to a screen that looks like the image below.
To get to the simulator you will be using, click Seasons and Ecliptic Simulator. It is located at the bottom. You shoudl be greeted by what is shown below.
This is a configuration of the Earth and Sun for a specific day. The images you looked at above are derived from screenshots from this tool you now have open. By properly manipulating this tool, you will be able to see the Earth’s position relative to the Sun on every day of the year panel and notice the role of tilt in determining which latitude receives the most intense solar radiation.
1. Take your time and play around with the interactive graphic on the left-hand side. Click and drag Earth’s orbit to change the perspective and click and drag the Earth to change its position in the orbit (this also will change the day of the year).
2. Begin on January 3 (perihelion) and click “start animation.” Start the animation from an overhead view. See example below. You will need to click and drag the circle representing Earth’s orbit.
3. Begin again on January 3 (perihelion) and click “start animation.” This time start the animation from a side view. See example below. You will need to click and drag the circle representing Earth’s orbit.
![]() Q4: What hemisphere is tilted towards the Sun on June 21?
Q4: What hemisphere is tilted towards the Sun on June 21?
![]() Q5: What hemisphere is tilted towards the Sun on December 21?
Q5: What hemisphere is tilted towards the Sun on December 21?
__________________________________________________________________________________________
Section 3
In this section you are going to explore the intensity and duration of solar radiation at seven locations located at 66.95° W longitude. The locations are evenly spaced along a transect that extends from the Arctic Circle to the Antarctic Circle. Click Transect to view the locations in Google Earth. Make sure Grid (located under View) is turned off. The transect is the thick red line and each location is denoted by a shaded white circle. Latitude, longitude, and elevation of the location of your cursor is shown at the bottom of Google Earth. Notice that if you move your cursor to the Southern Hemisphere it will have a negative latitude and if you move your cursor to the Western Hemisphere it will have a negative longitude.
![]() Q6: What are the approximate latitudes (i.e., to the first decimal place) of the following places? Zoom in on each circle to get the most accurate latitude.
Q6: What are the approximate latitudes (i.e., to the first decimal place) of the following places? Zoom in on each circle to get the most accurate latitude.
a. Arctic Circle, Canada:
b. Richardson, NB, Canada:
c. Tropic of Cancer, Atlantic Ocean:
d. Equator, Brazil:
e. Tropic of Capricorn, Argentina:
f. Malspina, Argentina:
g. Antarctic Circle, Antarctica:
Click Equinoxes to open the file in Microsoft Excel. For all seven locations, you will be examining the noon altitude of the Sun (i.e., elevation of the Sun above the horizon at noon) and daylength for 22 March 2014 and 22 September 2014, which are the two equinoxes. The higher the noon altitude of the Sun the more intense the solar radiation.
You are going to convert that data into a bar chart within Excel using the following steps:
- Go to the Noon Altitude of the Sun worksheet (tab)
- Select cells in rows 4 through 11 of columns B, C, and D.
- Under the Insert tab, select Column
- Under the 2-D Column options, click on first choice (Clustered Column).
The resulting chart shows the noon altitude of the Sun on March 20 and September 22 at the seven latitudes (i.e., the seven locations). Feel free to make the graph large and change its shape.
![]() Q7: Where was the noon altitude of the Sun highest and lowest on the equinoxes? Your answer should be either a latitude or a name for a specific latitude.
Q7: Where was the noon altitude of the Sun highest and lowest on the equinoxes? Your answer should be either a latitude or a name for a specific latitude.
Make a bar chart with the data in the Daylight Hours worksheet (tab). This worksheet is to the right of the Noon Altitude of the Sun worksheet. Look at the tabs on the bottom of Excel.
![]() Q8: Approximately how many hours of daylight did each of the locations receive on the two equinoxes?
Q8: Approximately how many hours of daylight did each of the locations receive on the two equinoxes?
As you just discovered, during the two equinoxes per year, the Sun is directly overhead the equator and all places on Earth receive approximately 12 hours of sunlight.
Click Solstices to open the file in Microsoft Excel. For all seven latitudes, you will be examining the noon altitude of the Sun (i.e., elevation of the Sun above the horizon at noon) and daylength for 21 June 2014 add 21 December 2014, which are the two solstices.
Make a bar chart with the data in the Noon Altitude of the Sun worksheet (tab).
![]() Q9: Where was the noon altitude of the Sun highest and lowest on June 21? Your answer should be either a latitude or a name for a specific latitude.
Q9: Where was the noon altitude of the Sun highest and lowest on June 21? Your answer should be either a latitude or a name for a specific latitude.
![]() Q10: Where was the noon altitude of the Sun highest and lowest on December 21? Your answer should be either a latitude or a name for a specific latitude.
Q10: Where was the noon altitude of the Sun highest and lowest on December 21? Your answer should be either a latitude or a name for a specific latitude.
Make a bar chart with the data in the Daylight Hours worksheet (tab).
![]() Q11: What locations had the most and fewest daylight hours on June 21? Your answers should be either (1) a latitude, (2) a name for a specific latitude, or (3) the name of a specific range in latitudes.
Q11: What locations had the most and fewest daylight hours on June 21? Your answers should be either (1) a latitude, (2) a name for a specific latitude, or (3) the name of a specific range in latitudes.
![]() Q12: What locations had the most and fewest daylight hours on December 21? Your answers should be either (1) a latitude, (2) a name for a specific latitude, or (3) the name of a specific range in latitudes.
Q12: What locations had the most and fewest daylight hours on December 21? Your answers should be either (1) a latitude, (2) a name for a specific latitude, or (3) the name of a specific range in latitudes.
As you just discovered, during the June Solstice the Sun is directly overhead the Tropic of Cancer (23.5° N) and during the December Solstice the Sun is directly overhead the Tropic of Capricorn (23.5° S). During solstices, there are extremely large differences in solar intensity and daylight hours between the northern and southern hemispheres.
Go back to the Transect in Google Earth and turn on the Grid option. The above difference in sunlight found among latitudes exist along all lines of longitude (e.g., great circles), with the most famous line of longitude being the Prime Meridian.
__________________________________________________________________________________________
Section 4
Below are screenshots from the Seasons and Ecliptic Simulator you explored earlier. The images show the Earth-Sun situations on December 21 (top) and June 21 (bottom) for a person standing at 23.5° N (i.e., the same latitude you are exploring in this section). The large panel and the top-right panel show which hemisphere is tilted towards the Sun. The bottom-right panel shows the noon altitude of the Sun and the resulting angle of the Sun’s rays. Please keep in mind that things in the images are not drawn to scale.
![]() Q13: What is the noon altitude of the Sun on December 21?
Q13: What is the noon altitude of the Sun on December 21?
![]() Q14: What is the noon altitude of the Sun on June 21?
Q14: What is the noon altitude of the Sun on June 21?
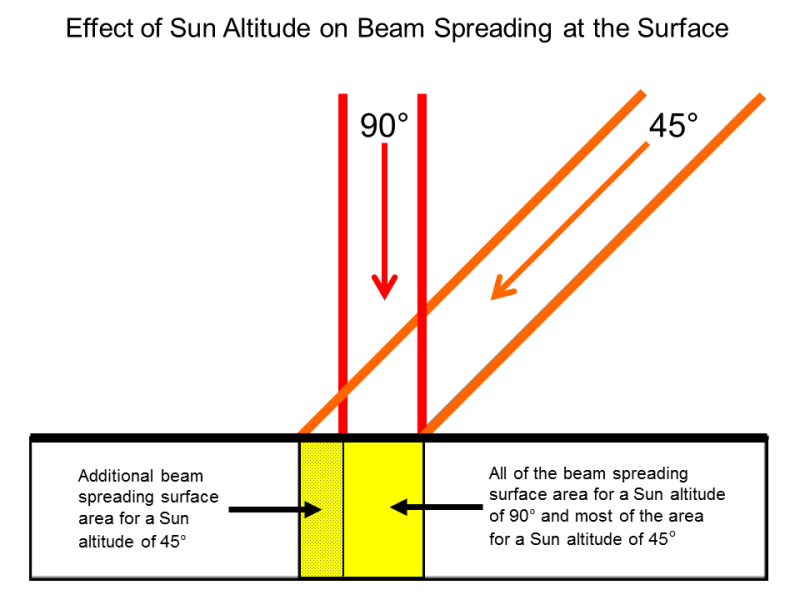
When solar radiation hits a portion of Earth at lower angle (i.e., 45° vs. 90°), the energy is spread over a larger area, and is thus weaker than if the Sun had a higher altitude with solar energy concentrated on a smaller area. Examining the image below will help you visualize the effect of this beam spreading. A location with the Sun directly overhead (i.e., a Sun altitude of 90°) receives 40% more solar radiation per square meter (e.g., W m-2) than will a location with the Sun at an altitude of 45°. The lower Sun angle (45°) causes the solar radiation to be received over a much larger surface area, which decreases the total amount of solar radiation in W m-2.
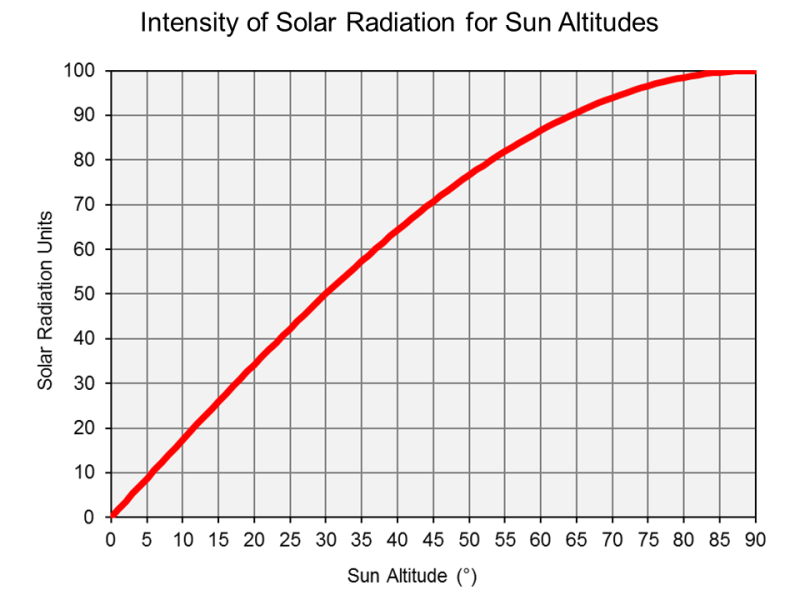
Below is a graph showing the change in the intensity of solar radiation with a change in Sun altitude. Notice how solar radiation is 40% more intense (i.e. 100 units compared to 70 units) when the Sun is directly overhead (i.e. 90°) as opposed to being at an altitude of 45°.
When the Sun altitude is low (i.e., when the Sun is near the horizon) there is considerable beam depletion along with the aforementioned beam spreading. Sunlight passes through more of the Earth’s atmosphere when the Sun altitude is minimized; thus, the atmosphere absorbs more solar radiation. Examples of minimum Sun altitude on a daily basis at a single location are sunrise and sunset. At sunrise and sunset, solar radiation has to pass through an atmosphere that is up to 40 times thicker than the depth at noon. In subsequent labs, you are going to learn about the specific ways the atmosphere affects incoming solar radiation.
![]() Q15: What two processes cause locations at high latitudes to receive less intense solar radiation compared to locations at lower latitudes?
Q15: What two processes cause locations at high latitudes to receive less intense solar radiation compared to locations at lower latitudes?
__________________________________________________________________________________________
Section 5
This part of the exercise is a comparison of solar radiation at Miami, FL USA and Cleveland, OH USA. LeBron has won titles for both these cities. Click Miami&Cleveland to open the file in Google Earth. These two cities are at approximately the same longitude, but their latitudes are substantially different.
![]() Q16: What are the latitudes and longitudes of Miami, FL USA and Cleveland, OH USA?
Q16: What are the latitudes and longitudes of Miami, FL USA and Cleveland, OH USA?
a. Miami:
b. Cleveland:
![]() Q17: Which location do you expect to have more solar radiation on the June Solstice and why?
Q17: Which location do you expect to have more solar radiation on the June Solstice and why?
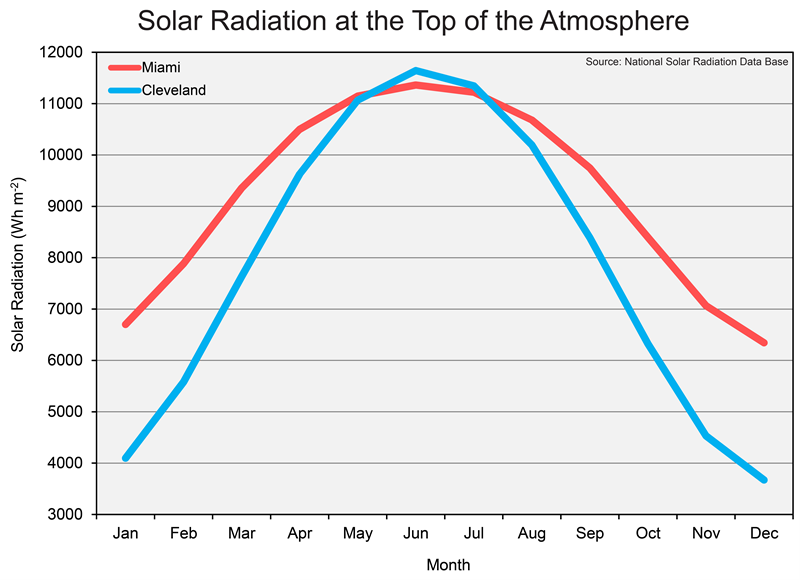
The figure below shows the typical solar radiation at the top of the atmosphere throughout the year at Miami and Cleveland. The amount of solar radiation is controlled by the intensity and duration of solar radiation. Intensity is determined by the noon altitude of the sun, and duration is represented by the number of daylight hours. On the June Solstice (i.e., June 21), the noon altitude of the Sun is 88° at Miami’s latitude and is 72° at Cleveland’s latitude. The number of daylight hours is 13.8 hours at Miami’s latitude and 15.1 hours at Cleveland’s latitude.
![]() Q18: What aspect of solar radiation causes Cleveland to have more solar radiation than Miami in June and July?
Q18: What aspect of solar radiation causes Cleveland to have more solar radiation than Miami in June and July?
__________________________________________________________________________________________
Section 6
Click January_Temperature and July_Temperature to open the files in Google™ Earth. The images show mean daytime land-surface temperatures from 2001-2010 derived from data acquired from a MODIS instrument aboard NASA’s Terra satellite. Remove the check mark next to July_Temperature to make only the January temperatures visible, and put a check mark next to July_Temperature to make the July temperatures visible again. The legend shows that the lowest temperatures are light blue and the highest temperatures are yellow. Please pan around the globe when looking at the temperatures.
![]() Q19: How did the locations of the warmest areas shift from January to July?
Q19: How did the locations of the warmest areas shift from January to July?
![]() Q20: Why is Aswan, Egypt one of the hottest places on Earth in July?
Q20: Why is Aswan, Egypt one of the hottest places on Earth in July?
![]() Q21: Why does Canada experience much larger differences in temperature from January to July than does Brazil?
Q21: Why does Canada experience much larger differences in temperature from January to July than does Brazil?
__________________________________________________________________________________________
Section 7
Before the next lab, write for yourself a one-sentence response to each of the following big questions of this lab.
Why do seasons occur?
Why does summer in the Northern Hemisphere occur when Earth is farthest from the Sun?
Not considering tropical areas, what is the general relationship between latitude, solar radiation, and surface temperature?

