When you’re trying to do serious data analysis, but you realize that you’re inside a dream within a dream…
I talked to Andrew Berens, one of the new SIFs here, and we discussed how to add a spatial relate the 3D Atlanta environment to the the real world for future applications such as holding your phone up on the actual street where the building was, but also more importantly having a specific relation of the maps from the Digital Collections, the Unity environment (which you view a broken version here! Please use FireFox, Chrome will not work currently.), and eventually to the research the research team has done.
What you’re looking at in the GIF is the Mercator Projection of a city (specifically Englewood, New Jersey).
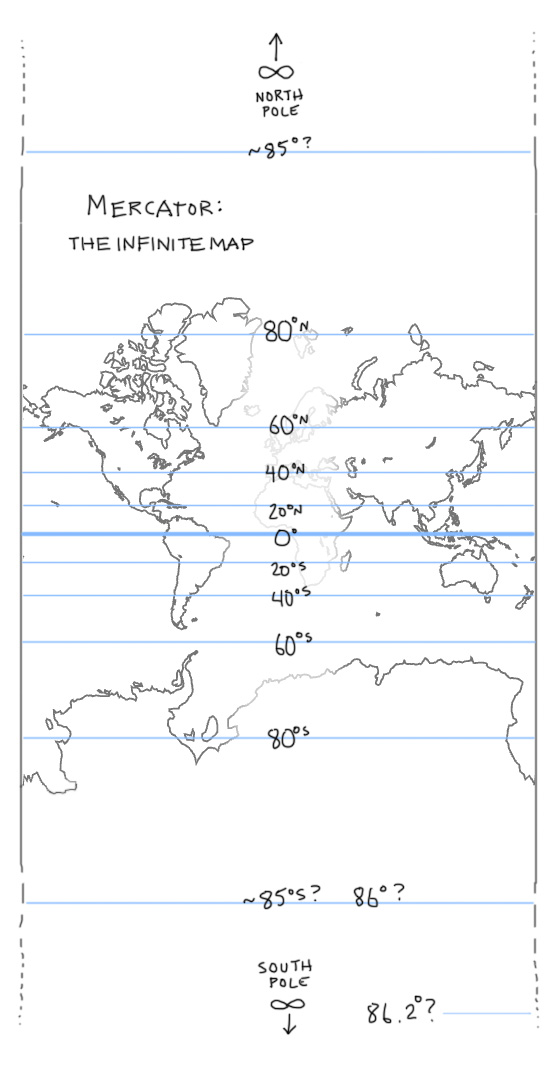
The map of the world (aka Earth) is wrapped around a cylinder to help us give a different version of the Mercator Projection. You see, Mercator is weird.

As you can see the poles are at infinity. Which makes it great for programmers like me which can discard without a care the poles (since no one really navigates there frequently), but it does provide some issues. Greenland is almost as big as Africa, Australia is bigger than the USA, and Antarctica takes up half the friggin planet. The reason why you would want the map around a cylinder is to decrease or at least make meaning of the Mercator projection on a big scale such as all of the continents.
The reason why the Mercator projection was made in the first place was to have all the continents one map for all to see in more or less their respective forms without doing weird stuff like splitting up the map into different parts.
However, if you zoom in on the inner globe to a scale such as a city inside of the cylindrical Mercator Projection, you get weird things going on.
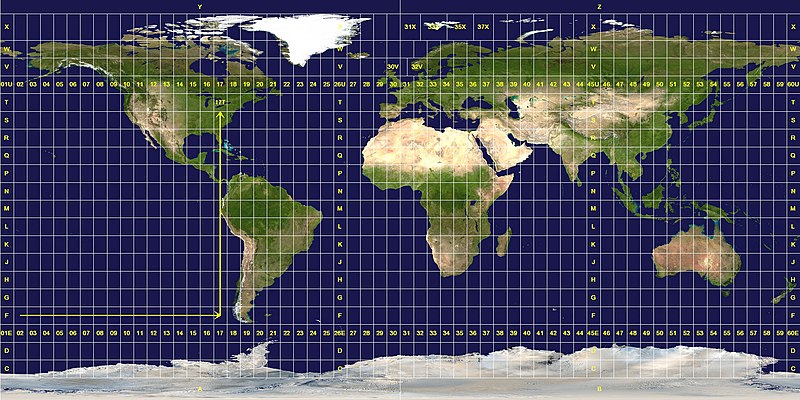
For the 3D Atlanta Project, we’ll probably do things in the Universal Transverse Mercator, or UTM for short, system. The main points why we’ll want to use this are:
- The map projection is mostly uniform.

- Atlanta falls within about a very small space, allowing us to simultaneously depict the small scale of a city without huge projection issues.
- We can use the UTM system in a small scale and say “five hundred and sixty thousand meters East”. You can do this in other map projections, but you can relate things to one another in small increments. “Classroom South is about 550 meters from Aderhold” is a pretty nice scale for computers. The smaller the scale of your grid, the smaller file size you’ll have to work with. (Better explanation here)
Having UTM in coordination with all of the other information will allow us to set a basis for the 3D Atlanta Project. By the end of the semester, we’ll be Oculus Rift ready! (and it won’t look broken anymore!) and we’ll add a lot of effects to it. We’ll also have talks/work on better enhancing the environment to fit our needs and then go back to allow for data analysis tools and other aspects of the project to be enhanced.
Until next time!