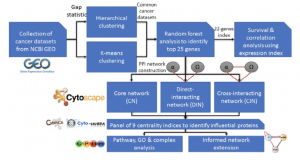
- Identifying cancer drug targets utilizing construction of complex interactome of proteins (article & article):
The approach for CaI construction and analysis. (a) The three databases BIOCARTA, PID, REACTOME and KEGG utilised for the extraction of pathways followed by disintegration into protein constituents and identification of any other pathways they are involved with. (b) The meta database STRING for finding the interactions of all the proteins pooled above. (c) The large component of the CaI constructed from pooled interactions above, coloured by 335 modules by Rosvall Algorithm with node size plotted as per degree (d) The analyses for power law, K-core, inter- and intra-modular connectivities for CaI constructed followed by the drug statuses against centrality measures, in clockwise manner.
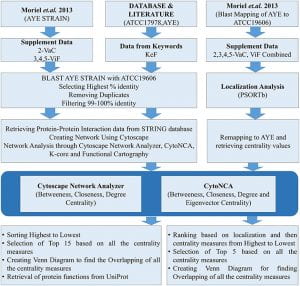
Following is the flow chart for the whole process:
The three SPINs and GPINs of A. baumannii reflecting the degree of connectivity. SPINs are represented in blue spheres connected through blue-colored curved lines for (A) VaCAB, having vaccine candidates; (B) ViFAB, with virulent factors; and (C) KeFAB, with key factors each with their interactors. (D) GPIN with proteins represented in black spheres connected with black curved lines to form the interactome.
The technical analysis of the constructed CaI. (a) Complementary Cumulative Degree Distribution (CCDF) of CaI showing Power-Law behaviour. (b) K-core analysis of CaI representing the size of each k-shell (number of proteins appearing in k-core but not in k + 1th core) from periphery (k = 1) to inner core (k-max). (c) Classification of CaI proteins (R) based on its role and region in network space, the P-Z space classified into 7 categories of hub and non-hub nodes. The latter has been assigned as ultra-peripheral (R1), peripheral (R2), non-hub connector (R3) and non-hub kinless nodes (R4) and the former has been assigned as provincial (R5), connector (R6) and kinless hubs (R7) as described by Guimera et al. Kinless hubs nodes are supposed to be important in term of functionality, which has high connection within module as well as between modules.
2) Analysis of drug resistance from deep sequencing data (article): Restricted Boltzmann Machines are an effective machine learning tool for classification of genomic and structural data. They can also be used to compare resistance profiles of different protease inhibitors.
The accuracy of the machine learning model:
3) Prognostic Model Predicts Survival in Cancer Patients (article):
An optimal prognostic model by the combination of six mRNAs was established. Kaplan–Meier survival analysis revealed effective risk stratification by this model for patients in the two datasets. The area under ROC curve (AUC) was > 0.65 for training and validation datasets, indicating good sensitivity and specificity of this model. Moreover, prominent superiority of this model to investigate prognostic biomarkers was demonstrated.
3) Common cancer biomarkers identified through artificial intelligence (article):
Identification of biomarker genes. (a) Heat map showing expression levels of top 25 cancer biomarker genes in ovarian and breast cancer types, (b) variable importance with gene ranks for all the genes, (c) mean decrease gini value for top 25 biomarker genes.


