In the course of the 3D Atlanta Project, we have done some valuable things for both people who have seen the project and for ourselves.
We’ve learned about huge amounts of data, like from the Digital Collections site showing Fairlie and Poplar Streets or more recent documents like this Historical Survey from the Facilities website that give a wealth of information not only for the 3D Atlanta project, but for other projects around SIF as well.
And just showing various pictures of the actual 3D environment is just enough to make people ooooohhh and ahhhh at what we have done.

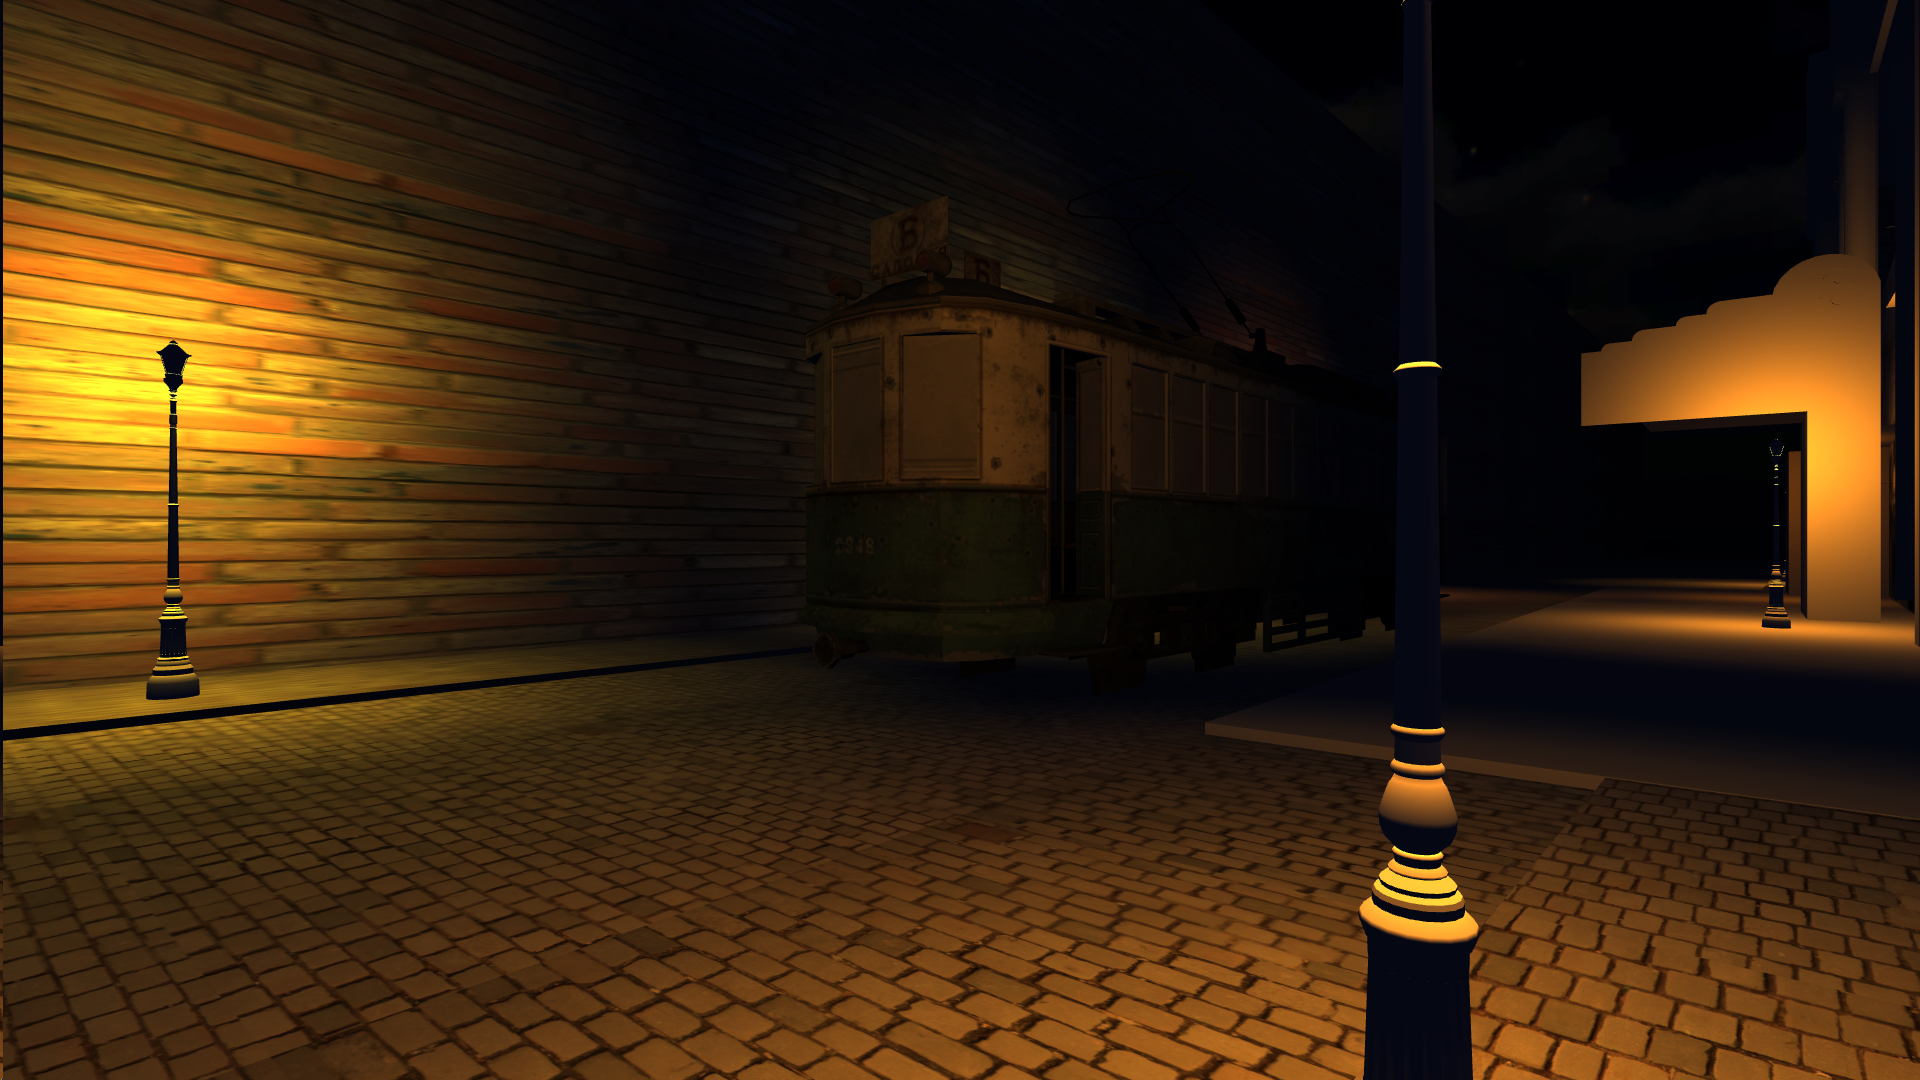
Better lighting coming soon!
But even then, we at the 3D Atlanta Project have hoped for more and for better. We want to expand beyond our bounds and tackle this project by hitting it head on.
This week, Brennan and Joe are away in Spain going to talks and meeting up with plenty of research teams, but they have emailed back some interesting plans for us. Brennan talked about focusing on the time element of the project, really see how things change in one place from each time period.
In some scientific papers I’ve read, this is called Diachronic Space. I’ve done a little research along Diachronic things, so I’ll make a blog post about it later, but basically it means to view things in one spatial reference in time. It is also used in reference to Linguistics as in people of a certain region at a certain time communicated with their fellow people in close proximity spoke the same language and maybe even create a dialect. Of course, some exceptions could be places like the Mediterranean Sea where evidence has shown that people spoke the same language with different jargon that still understood each other, but over time used maybe a single language like French or Arabic. And then over time, even French and Arabic or French and Arabic turned into another entire language!
But I’m getting a bit off track. More of that Diachronic stuff later. Right now, here is the progress on the 3D Atlanta Project.
- Shakib, Megan, Priyanka, and I (all SIFs) have been working on our models over the last few weeks and learning Blender.
- Priyanka and I are trying to texture this weekend to see if we can get something nice going in the Unity Environment. Megan and Shakib will continue building out.
- The focus now is getting all the models imported to the project and then requesting more photos near our current location to the research team.
- The final thing for this semester will be working on more models and getting them into the Unity Project to have a block ready for Oculus Rift.
No one said building a game would be easy. It’s definitely easier thanks to all our resources at the University.
But what if we wanted to build up more in less time? To really expand beyond our box models, yet still keep the aesthetics we want?
Here are my thoughts:
- Bringing the research team into the 3D environment. What this means physically is making a Unity plugin to bring together the 3D and research teams together. It’ll work like the following:
- The research team will continue to add things to an excel spreadsheet they’ve been working on with more parts to it. Currently, it just has a photo, name, year, and location of a building. We’ll add a LOT more elements.
- A column for Did you know information, another one for relevant information in the Digital Collections of other documents, and other potential information will be put in the excel sheet.
- The file will be scanned and turned into JSON (Basically another excel sheet but better) and will automatically populate the 3D environment with a dummy building in referenced space, user interaction elements for players to go an look at, and other relevant information, including other plugins.
- I believe for the research team a workflow with their excel sheet, map of the entire area, and relevant information inputs could be modeled in some way like the devmap.io project as a web app.
- The research team will continue to add things to an excel spreadsheet they’ve been working on with more parts to it. Currently, it just has a photo, name, year, and location of a building. We’ll add a LOT more elements.
- Custom timers for in-game events, possibly even a story for the game to be produced in the future.
- Ryan wishes to add narratives to the project, and with the speedy workflow, will allow us to reach character modeling stage a little faster. Then we can add narratives to specific buildings or locations, even other audio files like jazz music automatically!
- Definitely integrating huge data from Social Explorer and other relevant GIS projects directly into the Unity workflow. Seeing the change throughout time in significance. It would also allow for the Unity web player to be exported and allow for easy integration into the Atlanta Maps Project part of Atlanta Studies.
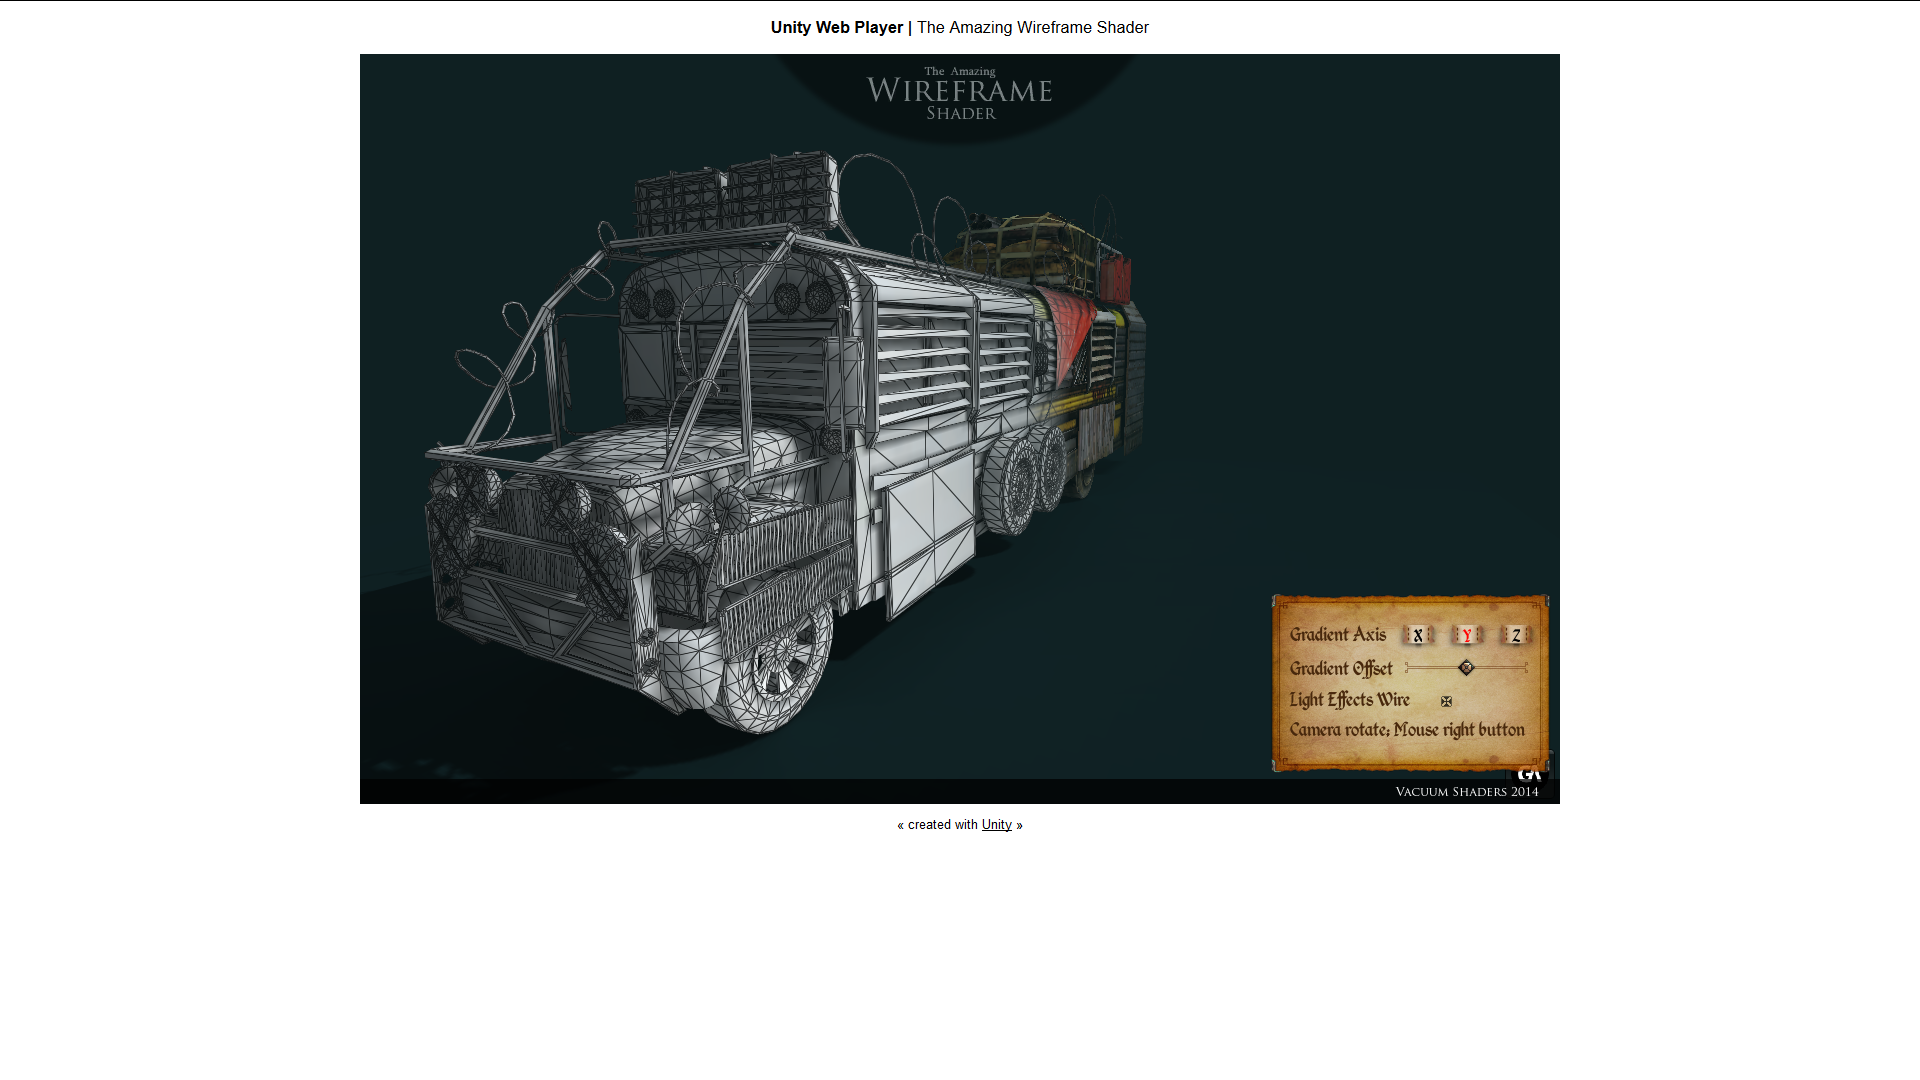
This would mean overlaying something like the Wireframe Renderer, and seeing the new present day building on top of the old demolished ones. Click the picture below to go to a live preview on what it could look like!
But those are some of my thoughts on the project. Can we do it is another question.
Well I have a 3D team consisting of 3 Computer Science majors and 1 Physics major with CS concentration, which is by far a very good team to teach and learn together, especially in the context of 3D space, a research team light years ahead of the 3D team, but are still looking for workflow tools, and then I have an army of both experienced and inexperienced coders that I could pitch this project to at PantherHackers—a large majority of whom would like to experience game design and development, and also other GSU projects that will be outsourced and worked on in CURVE.
I’m in over my head, that is for sure, but I think with enough pushes in the right places, the 3D project as well as all projects in CURVE can be facilitated better for benefit of the entire GSU community.
If you have questions about technical details, comments about specific parts of the project, or just fun questions to ask me, feel free to leave a comment below or talk to me at wmomen1@gsu.edu.


