The Tableau Experience

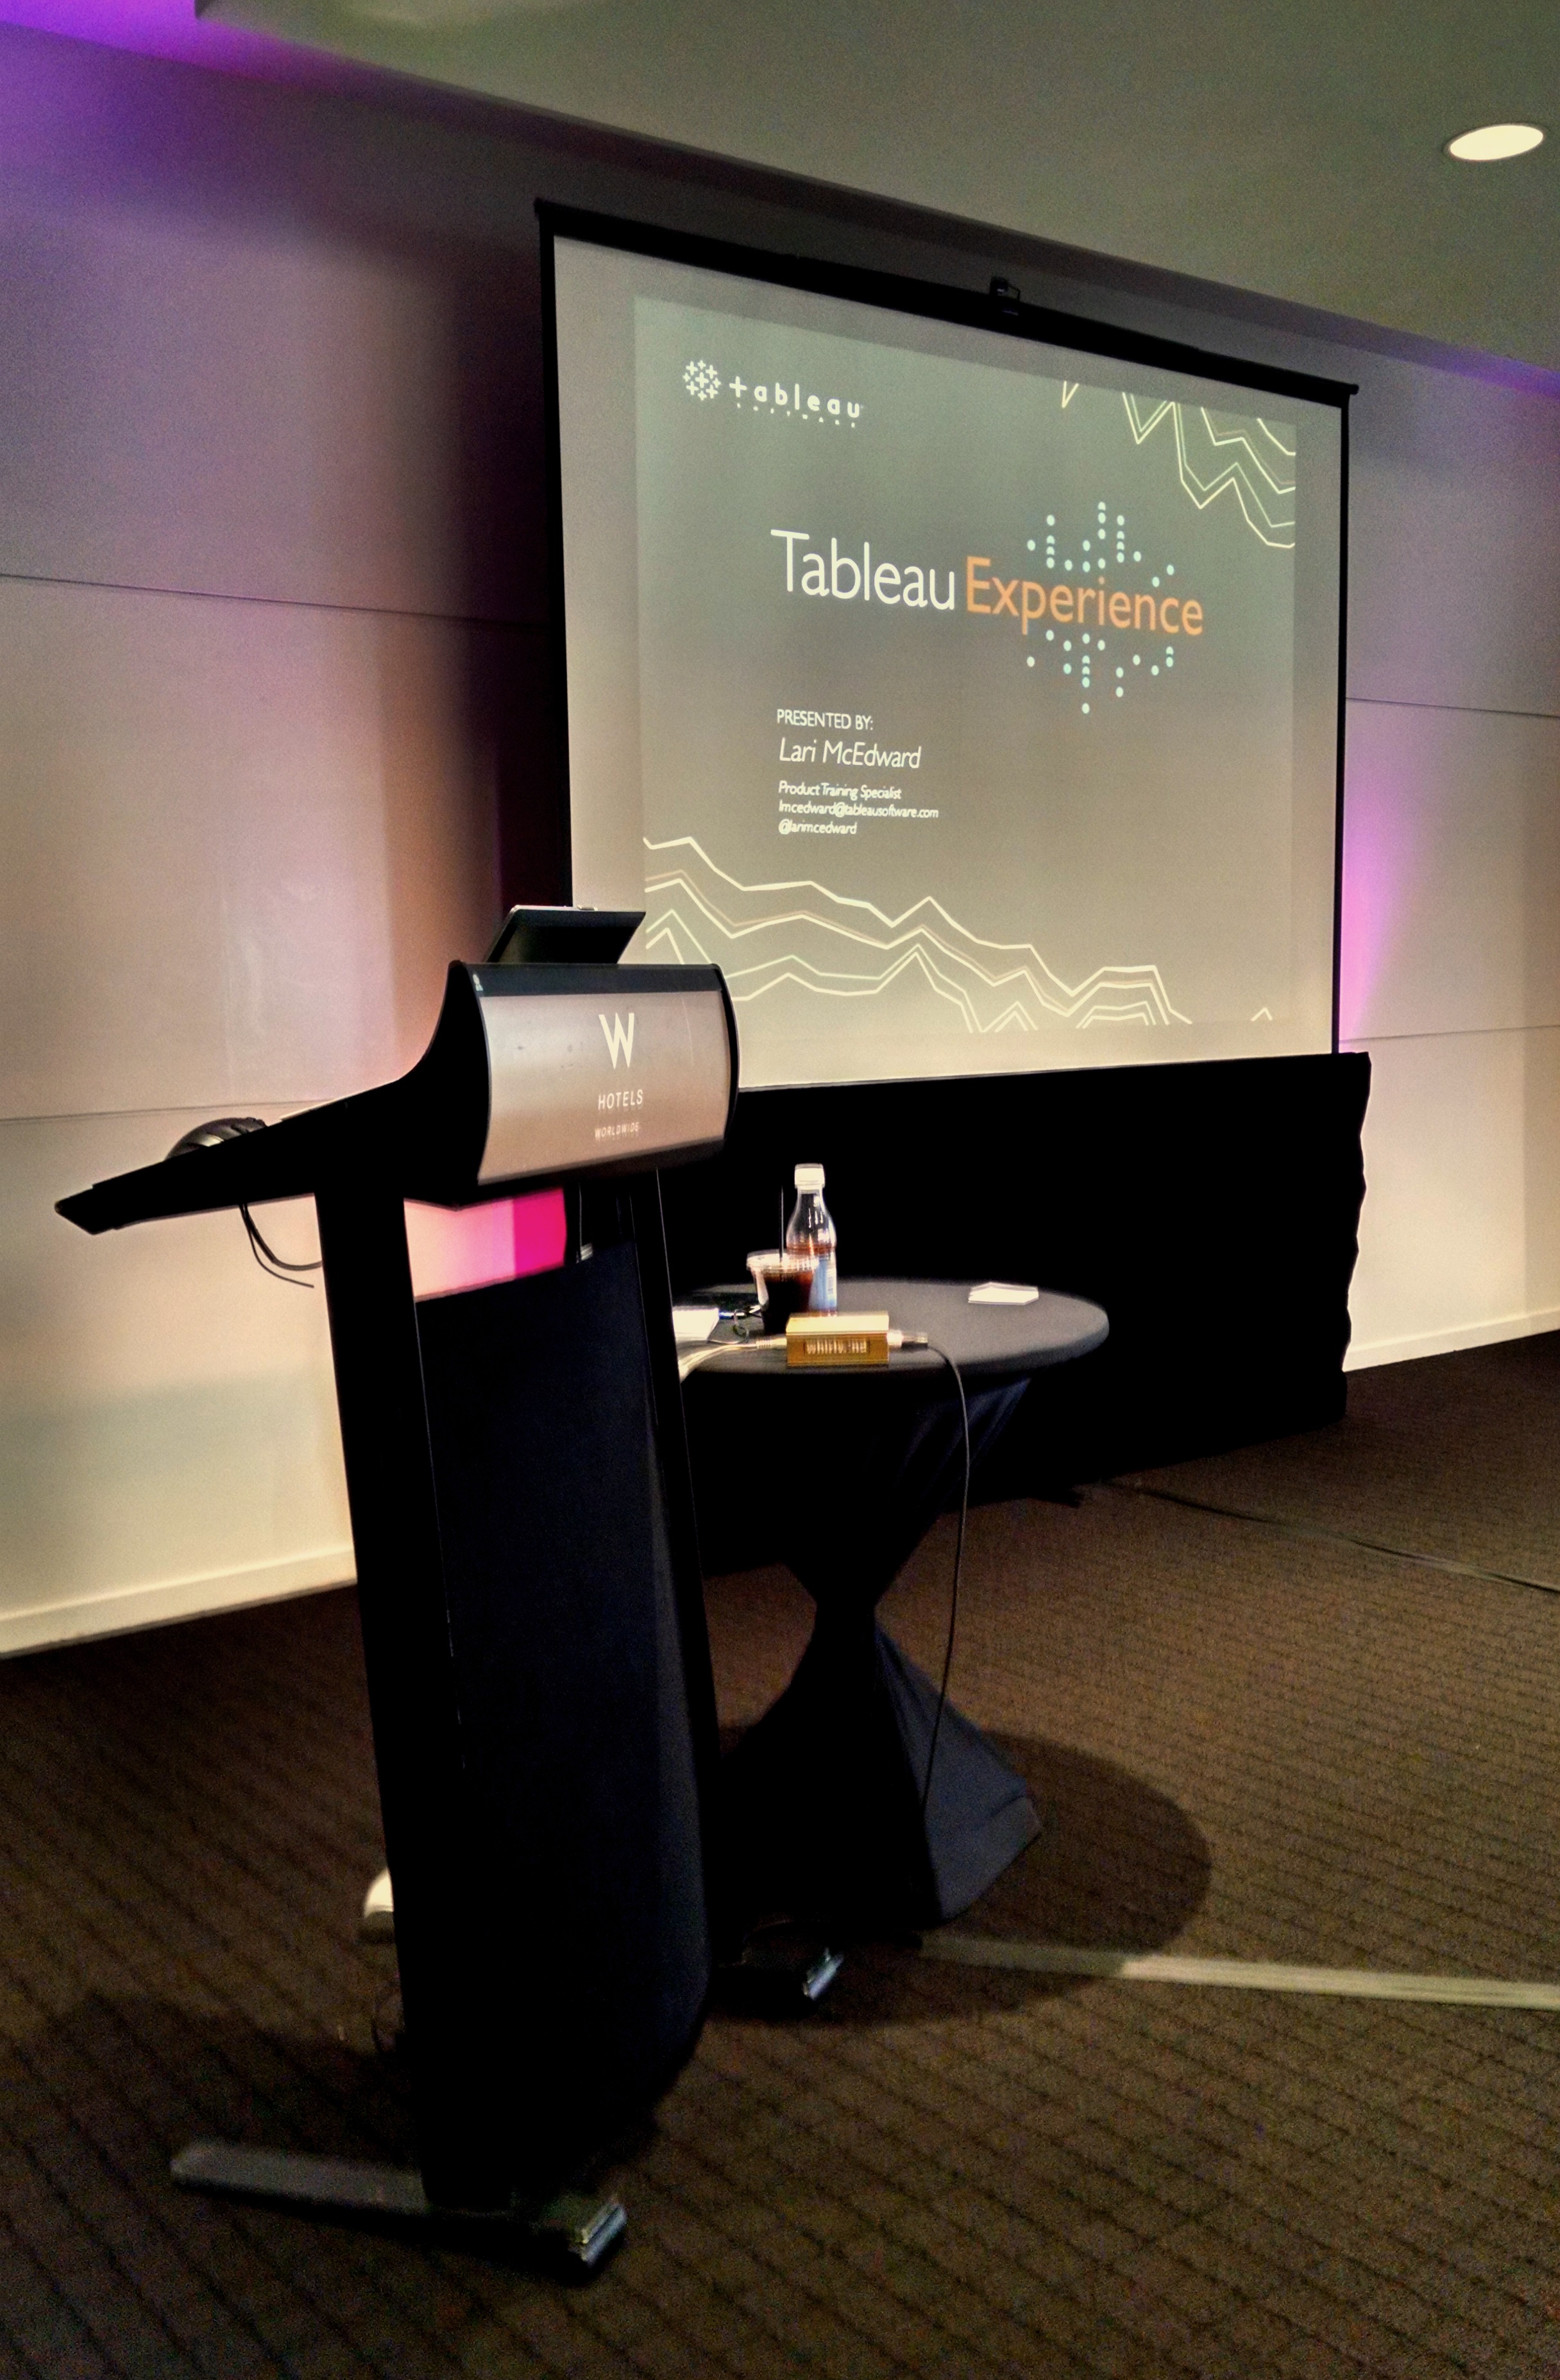
Today I attended “The Tableau Experience.” I’ve been struggling with what to call it: a conference, a convention… It had only one speaker, and a Q&A – and a wet-bar.  So… I’m settling with ‘experience’ as they do. What it really was though, was an advertisement.

Don’t get me wrong – I like using Tableau to recreate charts for the Tobacco Ebook I’m working on, and this ‘experience’ was worth it for several reasons:

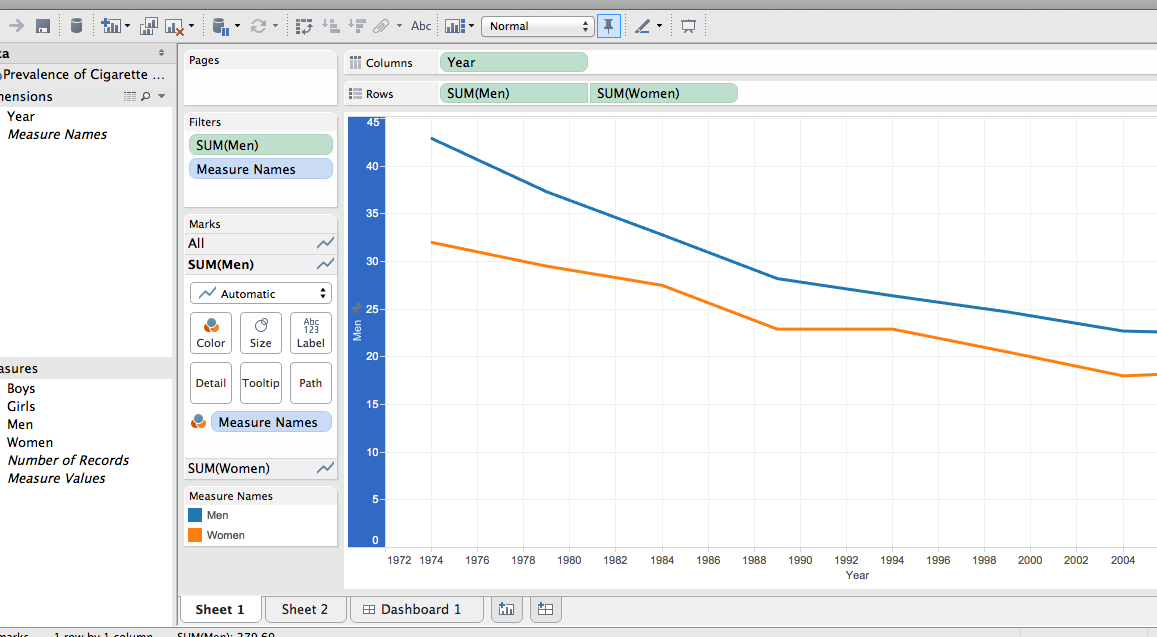
1. The speaker demoed several ways to share data that I haven’t seen in action since I’ve only been using it to create charts for data sets that are already created for me.

Tableau_Experience


2. There were a lot of people there from many different kinds of institutions.  I met others from universities like me – Georgia Tech, Gwinnett College, and so on. But I spent most of the time schmoozing with a lady from Home Depot, and then talked briefly to a man from a company called Norfolk. Everyone was using Tableau for something different – I’m pretty sure I was the only one making an Ebook.

3. I was able to ask about that pesky issue Ryan Cagle and I have been having in trying to get the distance between pane tick marks and labels to be exactly the same in all our charts so they’re uniform within the Ebook. Sorry, Ryan – there is no way to do this. The guy I asked said your idea was the smartest.

Overall, I’m glad I went to the Tableau Experience. And so I leave you with a picture of my spoils, the swanky bathroom in the wetbar, and the view from the 16th floor. Enjoy:

Tableau_Experience-2

Tableau Training

Since the beginning of SIF, I’ve been on the Tobacco Ebook project. I have learned iBooks Author layout and design techniques, which has completely reoriented my thinking about how design works, and increased my attention to detail by… a lot.

This week, I got moved from layout and table building within iBooks Author to recreating charts in a program called Tableau. Tableau can create really clean-looking, beautiful line graphs, bar graphs, and many other types of graphs and charts, like pie charts :). But it’s not easy. First, the data in the spreadsheets the book writers provided us with must be formatted in a way that Tableau ‘likes,’ which is a feat all on its own. If the data isn’t formatted properly, nothing works. Then, the chart has so many formatting options, its enough to make any beginner’s head spin.

Here are two screen shots of graphs I’ve been working with that I can’t seem to get to combine – one line graph and one bar graph:

Tableau line graph

Tableau Bar Graph

The good news is that once I figure out how to make the graphs function the way I like, they are actually pretty easy to make and turn out well. Thankfully, Will knows how to do most of it and is helping me figure out the trickier aspects. Phew!

iBooks Author and Me

I’m interrupting my workflow on the Tobacco Ebook project to talk about some issues I am having with the tech.

In my post, “It’s the Little Things,” from August 8th, I established that I am not a Mac.

Over the last several weeks, I have spent a considerable amount of time using a cute little MacBook Air. I’ve been familiarizing myself with a program called iBooks Author – a program that can only be used on an Apple product – as indicated in its name. I’m having more problems just figuring out how to download items and use Word on a Mac, that… hours later – I’m writing a blog about it.

Luckily, I have a lot of friends and colleagues who are Mac people. Today I have figured out how to track my downloads, save them in one easy step, and even how to change my scrolling options! I feel so accomplished! Sheepishly however, I did have to use my PC to figure out how to download a word document from sharepoint onto my own computer.

Which leads me to an interesting observation: When there are the EXACT SAME buttons available in the exact same places on both PC and Mac, I can’t see them on the Mac. It’s like I have some weird Mac blindness. This makes me wonder a lot about interface studies in my own discipline of rhetoric and composition – which may even lead to a paper.

Even frustration can lead to some pretty cool ideas and innovations, it seems.